Sunday, December 30, 2012

Things Americans Want From Higher Ed

Source: news@Northeastern
Northeastern University put together this infographic on the 5 Things People Want from Higher Education based on its recent national survey. The results were announced in November by Northeastern President, Joseph E. Aoun. Although the majority of Americans think higher education is critical to success, 83% believe the country's current system must innovate in order for it to remain competitive in a global leadership position. President Aoun stated,
"In over­whelming num­bers, they’re telling us that the system of today will not meet the chal­lenges of tomorrow. These find­ings are a wake-​​up call for those of us in higher edu­ca­tion to renew the social com­pact we have always had with Amer­i­cans by inno­vating across mul­tiple dimensions.”
What people want include global study/work opportunities, entrepreneurship, integration of professional work opportunities, hybrid courses, and lower cost. It is not only a wake-up call for higher education, but also for our K-12 system, particularly at the high school level.

Source: news@Northeastern

Monday, December 24, 2012

Social Networking: Talking About Ourselves

Source: Psychology Degree (detail)
The infographic, The Psychology of Social Networking from Psychology Degree, breaks down the world of social media and shows how much it is an integral part of people’s lives.

It seems we love talking about ourselves, even though nine out of ten people think we share too much. According to this graphic, when we reveal information about our own lives, it activates the part of the brain associated with satisfaction.

The numbers are staggering, and perhaps they should give us pause to think about how they affect the students we teach. From status updates, tweets, and adding friends, it seems Americans spend one out of every five minutes online using social media.


Source: Psychology Degree (detail)
Who knew that over 250 million photos are updated daily, or that 35% of people tag themselves in pictures? In other words, they become searchable. Yet how many schools actually teach students, or adults for that matter, what tagging means?

There’s a tech lesson here, and it’s not just for students. Teachers need to know just how much social media plays into the lives of our current generation of kids. If we want to encourage digital citizenship and understand their world of social media, we should take note of the details in this infographic.

Thursday, December 20, 2012

The Mayans And The Fiscal Cliff In Infographics

Source: Good.is
So what do the Mayan calendar and the Fiscal Cliff have in common? Perhaps nothing more than counting down the end of days for the world or allowing taxes as we know them to increase. There's certainly no shortage of information in the media, and it seems hard to avoid talking about these "events" with our students.

Source: KarBel Multimedia
The presidential election was no sooner over in November than we started heading for the precipice. Judging from the current state of affairs in Washington, we just might fall.

Nevertheless, we are always looking for ways to keep our students engaged as we approach the holiday break, and there are plenty of dynamic infographics available. Here are some of our favorites that we've shared with our students, and as always, they can be used in a variety of disciplines.

It's the End of the World As They Know It from Good.is has some interesting statistics regarding countries that believe the apocalypse is coming and the dire predictions of how it will happen. Another is the visualization called Countdown To 2012 from KarBel Multimedia. This design shows the ticking away to the end as gears inside a clock. There are others, such as the End of the World or the believers and skeptics infographic, which parallels the views from both sides about the prophecy, celestial significance, cataclysm, and consciousness shift.

Source: Demon-Ocracy Info (detail)
As for Fiscal Cliff infographics, there are plenty that do a nice job of showing the two sides of the issue, both on the tax increases as well as on the political points of view. Any of these visualizations make for great discussions about economics, finance, and politics. It's hard not to see how they would fit into any social studies class.

One particularly interesting visual is The Fiscal Cliff - 2013 - Cheat Sheet by Demon-Ocracy Info that uses mounds of $100 dollar bills to illustrate the financial situation. It also produced the following powerful, animated video using the same concept of using $100 dollar bills to visualize debt in the United States.


A few others include the infographic from ABC News, incorporating the red and blue color scheme to highlight the political affiliation, and The Fiscal Cliff: What Does It Really Mean?, showing a different representation of the information.

Source: ABC News
In all of these designs, it's important to carefully dissect the details. One of the things we do with our students whenever we use visualizations is to compare the data and information for discrepancies.

A key component in our curriculum is media literacy, and it's important always to include the core concepts of media literacy whenever students are looking at infographics to check for possible biases or misinformation.

Source: Colorlines (detail)
In addition, we continually want to reinforce the skills of graphicacy to build our students' abilities to be visually literate and to be visual thinkers. So much of what they see depends on a solid foundation in these areas.


Tuesday, December 18, 2012

An Education On Guns In America

Source: The Guardian
As K-8 teachers, we are heartbroken about the tragedy in Newtown, Connecticut. Our thoughts and prayers are with the entire community. It's difficult as teachers to fathom such a heinous act against children so young, especially as we walked passed our own first graders on Monday morning. Today, building the seeds of empathy seems more important than ever before, and we need to reinforce it as much as we can in our classrooms.

Although we want to know why this individual did this, we appreciate the news focus on the victims and the families who lost love ones, rather than on the perpetrator. It, nevertheless, begs the question -- why so many guns? And how many more shootings before we realize there is a problem with this country's obsession?

We've gathered a collection of resources in this post to point out just how much of an impact guns have on our society. We'd be wise to share this information with our students, at least from the middle school on up, to bring about awareness of a growing trend. The number of mass killings in just the last two years should not be accepted as routine, nor be made easy for lack of compromise in legislation.

Source: Good.is
Perhaps, just perhaps, we could start to bring attention to the over-proliferation of guns in America. According to the infographic Armed To the Teeth, there are 88.8 guns per every 100 people in the United States, and 62% of the population that owns a gun has more than one. Of those firearms, 17% are semi-automatic assault weapons.

Source: FastCoDesign (detail)
Another powerful infographic is Where Are the World's Small Arms?. This visualization makes clear that the spread of guns is not about the right to bear arms, but due instead to a billion dollar business. Just take a look at the stats.

The world's firearms economy is a multi-billion dollar industry, with $10.3 billion in the United States alone. Of the 8 million new guns produced each year, 4.5 million are purchased by consumers in this country.

So what can we do to teach our students about the dangers of firearms, especially when 68% of the 12,664 murders in 2011 in this country were committed by firearms? We would hate to think it's a losing battle to try.

If there were ever a need for education and a hard look at gun policies, it's now. When President Barack Obama spoke at the memorial service on Sunday night in Newtown, he asked, "Can we say that we're truly doing enough to give all the children of this country the chance they deserve to live out their lives in happiness and with purpose?" Judging from the data, the answer is no.

Source: The Guardian
Gun laws vary from state to state. The Stand Your Ground Gun Laws is an interactive map demonstrating just how varied these laws are across the country.

For more data on the percentages surrounding this topic, visit The Guardian's interactive maps of "gun ownership and gun homicides murder map of the world," "gun homicides and gun ownership listed by country," and "US Gun Crime Map." The United States is ranked among the highest when compared to other countries.

As we headed back into our classrooms yesterday, we did so with heavy hearts. We could not help but think about our fellow teachers who so heroically tried to shield the children, and we are sure that every parent in America was a little uneasy dropping their child off at school, or putting them on a school bus. We need to do more as educators to find ways within our reach to build tolerance among students and stop the violence. Just maybe, they won't think that they'll need to own a gun.

Sunday, December 16, 2012

What Is A MOOC?

Source: OnlineColleges (detail)
If your school is like ours, you might have a small percentage of teachers who have Twitter accounts and even fewer who actively use them either to lurk or participate.

Let’s face it, teachers are busy, a lot busier than most non-educators realize. So if you start talking about MOOCs changing the way “everyone” can learn, no doubt there will be plenty of colleagues who will ask, “What is a MOOC?”

MOOC stands for Massive Open Online Courses. They are rapidly growing in number. They are fed not only by the cost of higher education, but also by the variety of classes, the flexibility in schedule, and the notoriety of institutions that offer them for free. MIT and Harvard partnered to create edX. Coursera is another that offers free online courses, which several top universities partnered together to create. Other big names in the MOOC world are Udemy, Udacity and Khan Academy.

Source: OnlineColleges (detail)
The World of Massive Open Online Courses infographic from OnlineColleges provides a detailed breakdown of a MOOC, including their success, popularity, benefits, and issues. In addition, we liked this video we recently found that describes what a MOOC is using simple animation. It would be good to show at any faculty or professional development meeting.

Wednesday, December 12, 2012

Playing Or Paying? The Value Of Early Childhood Education

Source: Sesame Workshop (click for detail)
One potential victim of January's fiscal cliff is Head Start, the early education program for children from low income families. Rarely mentioned in the budget debates are the $590 million dollars that Head Start could lose in federal funding.

Our school here in New York maintains a relationship with two area Head Start programs. Each December, our students visit the centers to play games and sing holiday songs. Our middle-schoolers build toys in the wood shop, bake gingerbread cookies, hand-print wrapping paper, and stuff envelopes with crafts to spend the day with classes of 3-to-5-year-olds. Our students come back with lively stories, but even more so, they come back with a recognition of the disparate nature of "school." It's not just the physical differences between buildings, but it's also the realization of space and resources -- and the critical significance of early education.

Head Start began as an initiative from President Lyndon Johnson's War On Poverty. It has grown through sequentially updated federal grants overseen by the Administration for Children and Families in the Department of Health and Human Services. Head Start programs annually reach one million children in inner-city or rural areas.

Source: Citizen Action Of New York
Head Start's crucial mission is to promote school readiness and social and cognitive development through a host of early childhood services. Startlingly, though, several recent Congressional budget proposals have slashed its funding. The risk of the fiscal cliff also holds drastic implications for tens of thousands of children who would lose their access and their teachers.

Source: The Urban Child Institute
Some voices still argue whether the cost of high-quality early education is worth the financial trade-off. Other advocates for homeschooling declare that preschool exposes children to inconsistent discipline and undermines the parent-child bond. A recent New York Times column from Nicholas D. Kristof even explores the extent to which Appalachian families may intentionally avoid early schooling in order to keep their children illiterate and, therefore, receive government disability checks.

Source: W.K. Kellogg Foundation (click for detail)
Most educators, however, agree that early childhood education is more vital now than ever. The dynamic world of social interactions and linguistic guidance means that children can thrive under the stewardship of an experienced teacher. A well-intentioned dialogue does exist about the proper balance between play and academics in the early grades. Most agree, however, that the best teachers bring an invaluable toolkit of imaginative educational ideas to inspire young minds and aid in the joy of discovery.

Here we've gathered a collection of infographics that sum up the current state of early learning. Also, check out this video by designer Alena 'Ash' Heath for First Five Years Fund, an organization dedicated to achieving "better results in education, health, and economic productivity through investments in quality early childhood education for disadvantaged children from birth to age five." The organization even has a customizable toolkit to engage local media and Congresspeople in expressing support for early education up against the financial cliff.


Early Learning Matters from Alena 'Ash' Heath on Vimeo.

Saturday, December 8, 2012

Planting The Seeds Of Empathy And Service

Source: ASIDE, 2012
As we approach the end of another year that seemed to go by in the blink of an eye, the heaviness of world events both near and far looms over us. We face the dire prediction of falling off a cliff because our legislators have failed to compromise much, if at all, over the last four years. For some reason, we are bombarded every day with the prospect that if automated tax hikes and spending cuts go into effect, doomsday is around the corner. Add in the end of the Mayan calendar just before we plunge off the cliff, and we have one heck of a December to deal with before we say "Happy" New Year.

Of course, these two predictions do not account for all the other ills going on in the world, such as American troops still fighting a war in Afghanistan, or the sudden change from building a democracy in Egypt to the new leader Mohammed Morsi instituting absolute authority with unrestricted powers. More locally, many communities ravaged by "Super Storm Sandy" are still without the basic necessities of water, heat, and shelter for over a month. We can't help but wonder, where are the common refrains "Peace on Earth" and "Joy to the World" so often printed on holiday cards?

Source: Richard Law

Well, for one, they are in our students. With so much swirling around them in their click-and-swipe world, we often overlook the necessity to help them make things that touch the hearts of others. They truly have a genuine interest in current events, and they want to understand the world that to adults seems so negative. This year, we're trying to give them occasions to do just that, and our efforts are paying off in seeing them willingly volunteer to help in their free time. We don't call it community service; we just want them to give willingly to whatever cause they wish to help. Surprisingly, we have no shortage and plenty of repeat participants. It's about planting the seeds of service. By giving them opportunities to contribute and feel empathy, we can build character and self-confidence in knowing that they can make a difference.

Source: Richard Law

This fall they finished our memorial that launched our Pencils for Peace initiative by hanging one pencil for every soldier who gave his or her life in the war in Afghanistan. It was truly inspirational to see so many young people wanting to take part in the project. For Veterans Day, the students worked to create a map of the United States the size of a softball field. They added a peace sign, "USA," and the words "Thank You" in huge letters. They then lined the field with flags to guide other students who helped plant 2000 flags to honor the veterans who served our country.

To our surprise, or perhaps by a stroke of luck, when they turned to face the school photographer, the image appeared to form a heart around the map. The power and emotion felt by teachers and students were beyond words. As with so much of what we write about, this picture is worth a 1000 of them.

Other resources:

Wednesday, December 5, 2012

The Branding Of America

Source: IdeaLaunch
The December spirit of holiday consumerism is once again festooning the airwaves. Storefronts are trumpeting their gift-giving slogans, and email inboxes are overflowing with tantalizing discounts. The current branding bounty makes an interesting sibling to November's election season. One month ago, presidential advertisements waged a similarly irrepressible campaign for our dollars and our votes.

The need for media savvy, therefore, has never been more acute. And coincidentally, our students happen to be working right now on Prezi advertising presentations to create unique logos and slogans for the thirteen colonies. Many recent design projects across the Internet have focused on the branding of America. They offer lively perspectives on the nation's history, as well as keen case studies of graphic artistry. As a whole, they invite viewers to reconsider images that have become so iconic as to be routine. Here are a few of our favorites:

Source: Meg Jannott

Branding The U.S. Presidents


One of the most fascinating projects we've come across in a long time is designer Meg Jannott's personal challenge to imagine a unique brand and logo for each of the nation's 44 presidents. In "Branding The U.S. Presidents," she assembles a surprisingly diverse portfolio of altered graphics and signature fonts. Aside from their visual appeal, her images are great companions to any study of leadership or American history. Her eye for balance in layout and text offers an equally valuable lesson for artists of all ages.

Source: Jared Fanning

The United States Of Football


Students are accustomed to examining reference or thematic maps, but designer and illustrator Jared Fanning has created a cultural map somewhere in between the standard geographic expectations. Fanning takes advantage of what Geography and Earth Sciences Professor Rob Edsall calls "cartographic silences." He deliberately leaves out the standard political boundaries of states and replaces them with patterns of football fandom. In "The United States Of Football," Fanning paints the regional loyalty of teams, complete with "unincorporated territories" for the lands neglected by the NFL's marketing squad. Fanning's map is a great tool for teaching media saturation, financial literacy, and sports branding.

Source: Dollar ReDe$ign Project

Dollar ReDe$ign Project


Compared to many other nations' currencies, the United States dollar is relatively bland. Creative strategy consultant Richard Smith thinks "it's time to rebrand the buck." He has sponsored the Dollar ReDe$ign Project, a yearly competition to reimagine the stale green notes. Smith has collected a stunning array of innovative designs, which he hopes will renew faith in America's economy. We definitely encourage you to check out all of the entries on his site, to appreciate the full scope of his project and the fresh range of monetary blueprints. For students, it's also a tour of eminent Americans who might well deserve a place on a banknote.

Source: Library Of Congress

The Branding Of America


The Library Of Congress has produced a helpful site to let students explore the history of American brands. The product map and teaching resources at "The Branding Of America" explore the entrepreneurial minds and iconic products that have impressed their mark upon the consumer nation. It is a good site for teaching media literacy, as well as a fond trove of American nostalgia.

Wednesday, November 28, 2012

The Pencil - A Simple Lesson in Economics

Source: Competitive Enterprise Institute
The pencil is a simple "technology" compared to today’s tablet computers and smart phones. It looks easy to make such an uncomplicated tool. After all it's only wood, graphite and rubber, right? Not exactly.

The pencil, although much less complex to operate, takes a "village" to manufacture. The film I, Pencil: The Movie by the Competitive Enterprise Institute is based on a 1958 essay by Leonard E. Read and explains this multifaceted process and the network of people needed.


This animated film is a lesson in economics and collaboration. It's perfect for helping students understand the interdependence in producing manufactured goods in a free market economy and can be used at any grade level. Watching it will change the way they think and open their eyes to the worlds of industry, teamwork and dependency.

This simple presentation on the intricacies of producing a low-tech tool they all use is a perfect segue to introduce economics and promote greater financial literacy. Its straightforward presentation also demonstrates how it takes millions of people working together to produce a good so fundamental to learning, writing and communication.

Thursday, November 22, 2012

Connect 4 Learning: NYSCATE 2012

Source: NYSCATE
We just finished attending three days at the NYSCATE 2012 Connect 4 Learning conference in Rochester. The New York State Association for Computers and Technologies in Education (NYSCATE) assembled another stellar roster of speakers covering technology and learning. We met a lot of impressive educators who shared their expertise and resources.

It was great finally to meet in person many of the respected professionals we've admired via Twitter. The Social Media Kiosk offered a welcoming forum (and coffee!) for exchanging ideas. Cheers to @TomWhitby, @JimTiffinJr, @JenLaubscher, and @AdamBellow for their insights and friendly conversation. We are excited to follow the progress of Tom Whitby's #edchat radio broadcasts, with downloadable podcasts and expanding participation. Adam Bellow's keynote and session of web tools also proved why he's a down-to-earth master of his craft.

Source: ASIDE, 2012
The conference offered many subtle touches that encouraged collegiality and partnership during the well-paced days. Appy Hour presented a nicely self-initiated venue for trading favorite iPad tips. Collectable pieces of flair for each person's lanyard also perfectly mimicked the triumph of badging in the progressive classroom.

One clear message from all of the NYSCATE sessions was the relevance of social networks, BYOD, and mobile learning. These practices are no longer "emerging" but rather essential to contemporary learning.

Many thanks to the generous crowd who attended our two Monday sessions: D-LIT: Design, Literacy, Info & Tech and 10 Ways Twitter Makes Us Better Teachers. All of the resources and links highlighted in our workshops are available via the two links. We look forward to tweeting with our new friends and our expanding PLN of collaborators.

Our favorite hour was spent in the jam-packed Cascade room with Carol LaRow, who enlightened us to Google's dynamic special features. With humor and clear enjoyment, Carol opened our eyes to the amazing shortcuts and research options hidden within Google's search portfolio.

Source: Dinosaur BBQ
Finally, if you're ever at the Rochester Riverside Convention Center, watch the ball game at Legends but stroll three blocks for lunch at Dinosaur BBQ. The pulled pork and fried green tomatoes are worth the walk.

Monday, November 19, 2012

Twitter: The Best PD For Educators

Source: Elliott Design
Free, instantaneous and self-directed, social networks like Twitter carry enormous benefits for educators’ professional development. By following national experts and participating in worldwide chats, even skeptical teachers can share lessons, explore theories, and trade resources.

Many simple ways exist for teachers to gain insights into eye-opening concepts, articles, and resources through cooperative technology. Professional development can often be costly, but free social networks empower both educators and students to direct their own learning and internalize best practices from esteemed experts and fellow instructors.

Social networking has become an integral part of most families’ lives, but it has not yet become synonymous with education. As daily leaders in their students’ lives, teachers also need to be technological leaders in tapping into dynamic information streams like Twitter, Pinterest, and others to collect best practices and motivate young learners.

Benefits Of Twitter For Teachers


10 Ways Twitter Has Made Better Teachers
Who Am I? The Ten Types Of Twitter Chat Participants
Teaching With Twitter Visualizations


Twitter Basics


Teaching Teachers To Tweet
Cybraryman's Educational Chats
Twitter - A Necessity For Educators In 2012
3 Tips For Teachers New To Twitter
25 Ways To Get The Most Out Of Twitter
100 Of The Best Twitter Tools For Teachers By Category

Source: Education Week, Greg Kulowiec

Examples Of Twitter Chats


#edchat Archive
#2ndchat Archive
#sschat Archive

Twitter Hashtags


The Teacher's Quick Guide To Educational Twitter Hashtags
Cybraryman's Educational Hashtags
The 2012 A-Z List Of Educational Twitter Hashtags
In Praise Of The Hashtag 

Advanced Twitter


In The Pinterest Of Education
17 Ways To Visualize The Twitter Universe
15 Handy Twitter Tips And Tricks
8 Useful And/Or Fun Twitter Tools
The 20 Best Pinterest Boards About Educational Technology
Twitterize Yourself Into An Infographic
Tweet Topic Explorer

D-LIT: Designing Information With Technology

Get kids juiced about creating and publishing their work from writing their own stories to making motivational posters. Easy tech tools can transform learning. There are many web-based applications that allow educators to set up class accounts with privacy settings that do not require student e-mail addresses. These applications work for teachers, too, to publish resources or to show off what their students are learning.

Source: ASIDE, 2012

Source: ASIDE, 2012

Posts and Examples

D-LIT posts and lesson ideas

Resources

Storybird
Bookemon
Bookemon app
Voki
Voki Classroom
ToonDoo
ToonDooSpaces - classroom account
Marvel Superheroes
Comic Life
Comic Relief Wikispace
VoiceThread
VoiceThread K-12

Other Resources

Big Huge Labs
Spicynodes
Visual Poet - app
Snappy Words
Little Bird Tales

Source: ASIDE, 2012

Saturday, November 17, 2012

A Cornucopia Of Thanksgiving Infographics

Source: Infographic List (detail)
With Thanksgiving as the one true American holiday, it's only fitting to include a post about the many infographics available to engage our students. They're stuffed with enough trivia that there's plenty for a multitude of disciplines.

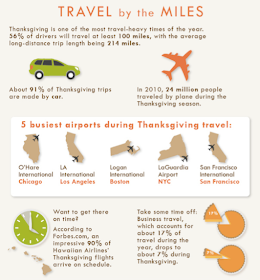
Since it is one of the biggest travel holidays of the year, there's no shortage of infographics on the topic. Check out Turkey and Travel or Planes, Trains & (Shared) Automobiles. Both can easily be used in math or geography lessons. Don't Get Your Feathers In a Bunch Over Thanksgiving Travel is another that could liven up any lesson. After all, it's not the destination, but the journey, and there are lots to map with kids.

Source: Yummly (detail
Of course, there's always room for financial literacy applications. with Thanksgiving Dinner on a Budget from Yummly. It's good for analyzing the rising cost to celebrate over the last 25 years, or for looking at the actual breakdown of food prices just to set the table. It even provides ways to save money when buying for the holiday. Make room for decimals!

Source: Visual News (detail)
Another one of our favorites from Visual News and Column Five is The First-Timer's Guide to Roasting a Turkey. Use this to prep the kids on proportion, ratio, percentage and more. It's chock-full of ingredients, and kids will gobble up the details.


Speaking of gobbling, even DentalPlans.com has an infographic, called Let's Talk Turkey, pointing out just how many turkeys you can buy with your discount dental plan. Now there's one for a media literacy lesson.

Source: Visual.ly (detail
While we know football might not be for everyone, it is part of many a Thanksgiving ritual, and it's not without its own infographic. The NFL Thanksgiving will appeal to our sports enthusiasts and no doubt to our classroom athletes or perhaps physical education teachers.

Whatever your taste in infographics, there are plenty to go around, and no doubt we'll have leftovers for another day. Happy Thanksgiving!

Wednesday, November 14, 2012

Looking Through the Lens: Play Is the Key

John Seely Brown gave the keynote address on "Cultivating the Entrepreneurial Learner in the 21st Century" at the 2012 Digital Media and Learning Conference. The Global One-Room Schoolhouse animation below captures the highlights from his address. This visualization on the importance of rethinking the approach to teaching and learning needs no further explanation. It is worth every minute, and every legislator, administrator, teacher, and student should make time to watch it.


The Global One-Room Schoolhouse: John Seely Brown (Highlights from his "Entrepreneurial Learner" Keynote at DML2012) from DML Research Hub on Vimeo.

Saturday, November 10, 2012

Veterans Day - Infographics About Those Who Serve

Source: US Census Bureau (detail)
Sometimes when we get caught up in the midst of the chaos from the loss of electricity and Internet access, we forget that there are others who faced far more: our veterans of foreign wars. "All I want is a hot shower and a cup of coffee" takes on a new meaning if you fought in deserts, jungles, and mountains. We begin to realize our inconveniences are small in comparison to those who served for months or years in harm's way, defending our nation.

Source: US Census Bureau (detail)
Veterans Day, like Memorial Day, is one of those calendar events during the year when we are off from school as a way to honor those who served our country. Whether it's before or after the holiday, we need to make our students aware of just how important these men and women are and to take the time out of our tight curriculum demands to teach them about what this day means. As with our other calendar posts, using infographics that visualize the facts and data to teach our students makes for simple and effective ways to incorporate the details about Veterans Day into our lessons.

Source: Military Benefits
For the first time in decades, we have record numbers of veterans returning home from the Iraq and Afghanistan wars. Many are unharmed, but a staggering number are wounded both physically and mentally. Depending on where you live in the country, those numbers can represent whole communities.


All of our students should know that the United States Armed Forces are made up of volunteers who put their lives on the line daily to keep us safe. Make it a point to talk about it in your classrooms.


Tuesday, November 6, 2012

Election Day - Our Favorite Voting Videos

After months of campaigning and strategizing, the 2012 presidential election has finally arrived. We have been fascinated by the candidates' messaging all through the primary and general election seasons. We've also enjoyed exploring different tools in the classroom to allow students to exercise their voices, before they are old enough to exercise their votes. If you'd like to look at some resources and lessons about "Designing A Candidate," check out these prior posts. For election day itself, here are some of our favorite videos to share with students. These lively, informative clips can make sure everyone is ready to understand the eventual electoral results.

Vote For Somebody! It's Your Civic Duty (from Democracy Prep)


Explain It To Me: Running For President (from CNN Video)


Does Your Vote Count? The Electoral College Explained (from TED-Ed)


Electoral College 101 (from NYTimes OpDocs)


Electing A US President In Plain English (from Common Craft)


Isarithmic History Of The Two-Party Vote (from David B. Sparks)

Friday, November 2, 2012

Making It Personal - Visualizations To Teach Hurricane Sandy

Here in Long Island, New York, we've been hit hard by Hurricane Sandy. We don't have power, heat, gas, or cell service, yet we are grateful for shelter and family. We are especially concerned for our friends who have lost their homes due to flooding, and our hearts go out to the communities in New York, Connecticut, and especially New Jersey that have seen neighborhoods destroyed and loved ones lost.

Source: The Huffington Post
(click for full graphic)
Our school, miraculously, is up and running. Somehow ours is the only school for miles with power, and our students returned yesterday to warm meals and a semblance of normalcy. We've been searching for ways to discuss the storm. The kids have plenty of war stories about transformers exploding and homes ablaze. Many have trees still on their roofs. Here are a few of the resources we've found useful in assessing the impact of Hurricane Sandy. It's also a good moment to remind ourselves of the indomitable, pioneering spirit of everyday heroes.

Finally, if you are in a position to help, please consider donating to the Red Cross to help those in need. Our entire region thanks you.

Visualization Links:


The Web's Best Visualizations Of Hurricane Sandy
Source: LiveScience
(click for full graphic)
The 5 Best Maps And Visualizations Of Frankenstorm Sandy
What Can Twitter Tell Us About Hurricane Sandy Flooding?
A Stunning Map Of Hurricane Sandy's Winds
Google Crisis Map - Hurricane Sandy

Teaching Links:


Teaching Hurricane Sandy: Ideas And Resources
Eight Classroom Resources To Help Teach About Hurricane Sandy
Using Hurricane Sandy As A Teaching Tool

Infographic Links:


Hurricane Sandy Leaves 17 Million People In FEMA Disaster Areas
Timeline Of Hurricane Sandy's Week Of Destruction