We’re sure many of our readers have received the proverbial end-of-year “holiday letter” recapping events in the lives of friends and relatives. Often these densely word-processed documents, peppered with pictures, seem more like a chore to read rather than an enjoyable update. Graphically designed they are not, and a tutorial on “less is more” would surely improve the overall layout.
Recently, our friend and colleague, Gina Sipley (
@GSipley), forwarded an “infographic holiday card” she received. We then did a little digging. To our surprise, it turns out that using infographics to report on the happenings of the past year have been trendy for quite sometime. Who knew that data visualization had hit the holiday card market?
Resources abound on using this idea, and there are
Pinterest boards with loads of samples. We even found a “
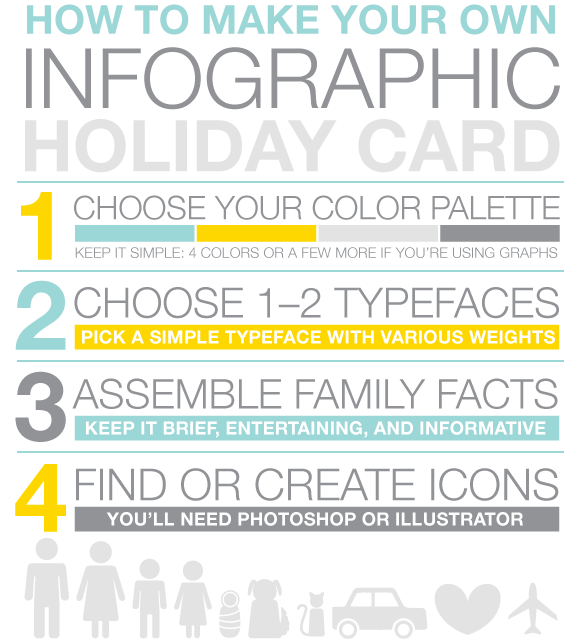
how to make your holiday infographic card” by Alma Loveland for
Nicole’s Classes.
It provides step-by-step instructions in design as an infographic, with explanatory text. The
tips
for laying out an infographic are useful and could be
used as guidelines for any newbie wanting to try his or her hand in the
process of creating one.
While we are not planning on sending out our own “infographic holiday cards,” it did get us thinking about how to use this idea in our classrooms.
It would make an excellent way for learners or teachers to graphically represent the highlights of the year using data, text, and images in a simple, well-designed infographic. By flipping the content, it's a perfect way to underscore accomplishments, field trips, projects, and more.
Happy Holidays!


)
Great post on infographic holiday cards. I agree that a teacher could use this in the classroom to represent highlights of the year. Though I feel that it could be taken even further. A teacher could design one of these to send out to the students and parents before the beginning of the school year, highlighting the things that the students will be learning about. A teacher can also have the students design one as an introductory activity at the beginning of the year. The students can design one of these cards to share with the class more information about them. The teacher can also design one to introduce a new unit to the students, as the card can include what the students will be learning about in the unit. I also think that the students can design one of these cards for a presentation, it can include facts about the material they are presenting. These cards open up a whole new world of possibilities for the students and the teachers.
ReplyDeleteThank you for your comment and other suggestions. We have used infographics in many different areas of the curriculum. Please take a look at some of our other posts on how to integrate visualizations in student learning.
ReplyDeleteSuper post. I've been thinking about this topic.It is excellent way for learners or teachers to graphically represent the highlights of the year using data, text, and images in a simple, well-designed infographic. TCFC helps creating infographics design that increases the impact of messages to increase conversion rates for your business.
ReplyDeleteHave you ever wondered what attracted you in a new iPad, new smartphone, or any other modern gadget? Was it its fascinating technology or its simplicity of design? Design has become an essential communication tool and it's hard to imaging new technology without it. infographic design company
ReplyDeleteGreat post on info graphic holiday cards. We have used info graphics in many different areas of the curriculum. Please have a look at some of our other related posts on latest fashion trends and clothing plus shopping guide for women.
ReplyDeleteI think this is an informative post and it is very useful and knowledgeable. therefore, I would like to thank you for the efforts you have made in writing this article.
ReplyDeletepakistani lawn brands
I go to favorite this website it seemsvery helpful .
ReplyDeletelawn suits
Please let me know if you’re looking for a article writer for your site. You have some really great posts and I feel I would be a good asset. If you ever want to take some of the load off, I’d absolutely love to write some material for your blog in exchange for a link back to mine. Please send me an email if interested. Thank you!
ReplyDeletePakistani wedding dresses
Cool stuff you have got and you keep update all of us.
ReplyDeletesummer lawn collection
ReplyDeleteWow, cool post. I’d like to write like this too – taking time and real hard work to make a great article… but I put things off too much and never seem to get started. Thanks though.
summer collection
Excellent post. I was always checking this blog, and I’m impressed! Extremely useful info specially the last part, I care for such information a lot. I was exploring this particular info for a long time. Thanks to this blog my exploration has ended.
ReplyDeletelawn collection
Thanks to this blog my exploration has ended.
ReplyDeletebridal dresses
Our service ( https://lindaalduin.substack.com/p/what-is-a-book-review ) checks for plagiarism using the best plagiarism detection tools before any student receives their papers. Furthermore, each essay assigned to a writer is done from scratch by them.
ReplyDeleteKMB Legal have an experienced team of Gold Coast person injury solicitor ready to help you lodge a compensation claim for your injury. Enquire about our No Win - No Fee Personal Injury Lawyer.
ReplyDelete