It seems a fitting close to the year to think about humanity. As a nation about to embark on a new era in governmental politics, the likes of which we have not seen, it is important to take a moment and reflect on change and how it affects all of us. We’ve used the video called the History Of The World In Seven Minutes for years with our students to demonstrate not only how improvements in technology changed the course of civilizations but also how progress moved at an exponential speed as it advanced.
Every December 31, we celebrate the start of a new year, and we generally think in terms of the last 2016 years. But what if we rethink when the human era began? The video animation from In a Nutshell, entitled A New History For Humanity - The Human Era, does just that by marking the history of the human era according to the Holocene calendar. It could change the way we think about history; we would not be forgetting 10,000 years of human progress. A year zero could apply to all humanity and all cultures.
So as we approach the year 12, 017 HE, let us kick off a new year by building peacemakers and peacekeepers for all of humanity.
Interactive mapping techniques invite students to connect with content to visualize information beyond mere location. Mapping challenges learners to think, develop literacy skills, and understand the complexity of global issues. It enables learners to seek new ways to look at information through a lens of inquiry-based analysis.
Fresh perspectives on traditional maps can help students classify the images they encounter and can assist them in developing their own visualizations of places and events. This finely-tuned practice reinforces the notion of relational meaning. It taps the core skills of graphicacy through the synchronicity of visual literacy and visual thinking.
As a result, our students become better geographers and designers by interpreting existing maps, by drawing their own maps with a cartographer’s eye, or by creating visualizations with a keen sense of space. Students must decode the augmented reality (AR) by "reading" images and internalizing pictorial stimuli. These precise, learned techniques foster confidence both in deciphering and in creating pictorial representations, as well as developing critical thinking skills to better understand the world.
The theme for the 2016 annual conference of the New York State Association For Computers And Technologies In Education (NYSCATE) was "Unleash The Superhero In You." This effective branding throughout the conference hall — and the colorful capes given to every attendee — spoke volumes to the notion of teachers as heroes in seizing opportunities and embracing technology, and often struggling against the curmudgeonly villains standing in their ways.
After three days of sessions and keynotes, kiosks and meet-ups, it was more clear than ever that educators are feeling they have the necessary tools to invigorate the learning potential of their students. Every teacher we met was excited to try a new web app or a backchannel to decentralize daily instruction. As Chromebooks catch up to (or surpass) iOS devices, the Google Apps For Education (GAFE) suite of tools is clearly permeating state-wide districts. As videos and online media put information squarely in the hands of learners, both children and teachers feel more empowered than ever to chart their own courses in meeting the various standards.
For our part, we are grateful to the 60+ participants who sat on the floor and stood against the walls for our presentation on Sunday, November 20, 2016, about “Student Videos & Animations Empower Creativity.” We apologize to those who were turned away for space reasons, and we have put all of our resources and slides online to share with any interested parties. Thank you to all of the attendees for the insightful questions and terrific recommendations about lessons and tools related to student projects and videos.
In hearing from the other experts in the terrific workshops during the conference, highlights that stood out included the tips on formative assessments from Steve Garton (@sgarton121) and Jeff Mao (@jmao121) of Common Sense Education, as well as the annual App Smackdown from Rich Colosi (@richardcolosi), Ryan Orilio (@ryanorilio), Mike Amante (@mamante), and Monica Burns (@classtechtips).
Other eye-opening sessions were engaging the writing process using Google Apps, WeVideo, and Recap with Megan Hugg (@Megan Hugg) and Lindsey Peet (@LindsMariePeet); liberating students from paper using ePortfolios with Betsy Hardy; and tapping the lesser-known features of Google with Carol LaRow (@larowc). Student coding, blended writing, and shared collaboration also emerged as recurring themes within the high-quality professional development. Perhaps the keynote comment by Adam Bellow (@adambellow) summed it up best, "Technology does not drive change; it just enables it."
Source: ASIDE 2016
The lake-effect snowstorm that blanketed downtown may have kept some New Yorkers homebound, but it made for a tight-knit group in the warm confines of the Joseph A. Floreano Rochester Riverside Convention Center. It also meant that Dinosaur BBQ was blissfully quiet on Sunday night, as we savored our favorite fried green tomatoes and spicy pulled pork. Pane Vino on North Water Street continued to rank as one of the best restaurants anywhere in the nation. And we also recommend Starry Nites Cafe in the arts district as a short hop away for a quick latte and chicken chili after perusing handmade jewelry at Craft Company No. 6.
Finally, we want once again to give a big shout out of thanks to the NYSCATE conference organizers for all they did in staging this seamless annual get-together. The smoothy run sessions and the high-quality breakfast / lunch / dinner included in the overall fee, as well as the warm welcomes and conversations throughout the event, confirmed once again why this is the best confab of the year. See you in 2017.
Creating videos and motion graphics nudges both students and teachers to blend a host of proficiencies. It involves visual design in colors and templates, just as it requires language skills of narration and storytelling. It supports key technological skills in manipulating online media, and it reinforces the importance of publishing in sharing child creations with peers and parents. Kids teaching kids is the purest model of learning. It is the model of the student-centered classroom, because they become the educators of their peers.
Video production allows students to stitch together a narrative and storyboard each moment in the process that combines logical reasoning, cause-and-effect, and content mastery. They also must employ their graphicacy skills to fashion compelling and appealing visual displays. These quick-cut movies and short animations combine icons and text to communicate a message. Explainer videos, for example, are perfect for the classroom. They blend voice, image, and language into compelling presentations for students to learn. Content created using app editors or motion graphics provides a way for the brain to receive information through both the eyes and ears. Learning tools that can tap into both modalities have greater effectiveness in fostering understanding. They add layers of meaning for nuanced, standards-based education.
It is important to employ interactive ways to engage and share student work that builds alternative ways for students to design content, collect feedback, and reflect on the creative process. This requires using resources that engage learners in the classroom much the way they are outside of it. The gradual spread of technology tasks is invariably shifting classroom education toward a more student-directed model. As we move more and more into the blended, flipped, and social world of learning, we need to encourage creative interactions and self-directed investigations with the knowledge that our students can be active participants in the education process.
This eye-opening video made the students stop and think a good deal about how viewers could be so easily influenced through algorithms that deliver content from a single point of view, and moreover, how it often leads to a one-sided look at information. It unnerved them a little when they found out that “someone” was aggregating their search results based on likes. It also surprised many that 60% of Americans use social media to get their news.
One important takeaway recommended in the video was to watch or listen to another media network that you “violently” oppose to avoid being caught up in a social media stream that feeds only what one wants to hear. With so many modern media outlets openly biased toward the right or left, it was important for these young minds to see the value in comparing information.
The media literacy program at our school has been in place for over 16 years, and it starts with the first graders. We’re fortunate, too, that our students are permitted to use social media for learning; it allows us to update our program to include new media literacy skills as part of the learning process. In an age of media bombardment, learners must be permitted to practice skills not only for today’s world, but also for their future.
The New Media Literacies video below drives this point home. In order for learners to be fully engaged with today's participatory culture, they need the social skills and cultural competencies to do it. It, therefore, must be integrated into the learning environment.
We witnessed first hand just how much it means for students to use their voices to express opinions in a world of shared content. Media is not just questioning the traditional types, such as newspapers, magazines, or websites. It’s participatory. They felt empowered to share their ideas with others and to follow what others had to say. Students need access to new media as it evolves in real time, their time, in order to be discerning learners.
On Tuesday, Americans will elect their next president. While a record 200 million citizens are now registered to vote, a majority do not understand the process for choosing the commander-in-chief. With a little conversation, the seemingly esoteric nature of the Electoral College is actually quite simple to grasp. Regardless, therefore, of the particular vitriol of this year's contest, teachers and students deserve to take a moment this week to learn about our Constitutional republic. A host of helpful explainer videos and animated infographics are available to educate learners of all levels about the Electoral College.
We work in an elementary school. So if you’re like us, Halloween always makes it difficult for kids to focus, especially with a school-wide parade at the end of the day. Our attitude toward keeping their attention is to use Halloween content to design lessons that tap the spirit of the day.
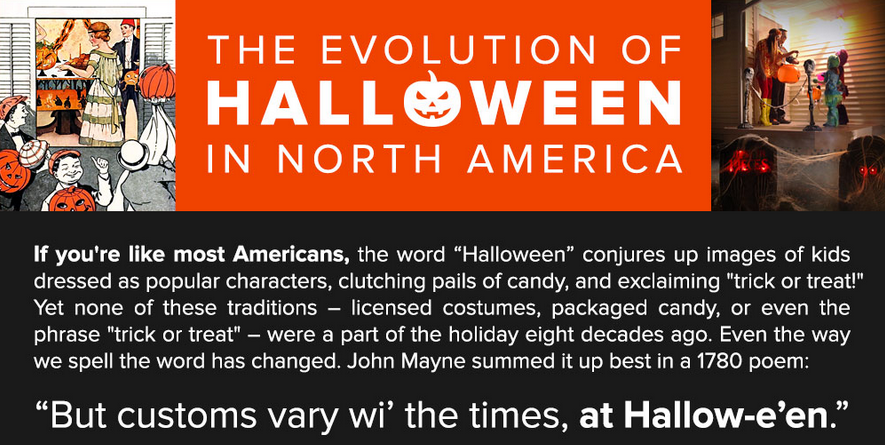
This year we found two new infographics to use with our learners. The first is The Evolution Of Halloween In North America. The timeline begins before 700 in three separate periods in history; from the 1900s to present, the timeline is arranged by decade.
The two-column layout of this infographic provides a visual connection between the history of the holiday and the literature and popular cultural aspects of the time. It’s perfect for scavenger hunts on the evolution of costumes, candy, and traditions.
The other infographic that we thought educators would find useful is Trick Or Treat Your Way Into Halloween Sales Like A Pirate. The creator also designed "min-fographics," perfect for educators to put into any presentation software. The whimsical and colorful display to illustrate the economics behind the holiday is sure to enhance any math lesson.
The different sections of this infographic also provide ideal opportunities for data analysis of charts and graphs. They are just the right mix of visually appealing graphics with real numbers to engage students in making comparisons regarding sales, percentages, popularity, and more.
We firmly believe a little deviation away from the routine to keep students focused pays off in the long run. Using infographics reinforces graphicacy skills, incorporates a little media literacy using Halloween hype, and celebrates learning with a little fun.
As the national polls and the state-by-state predictions shake out in the final month of the 2016 campaign, the focus turns even more to the Electoral College as the actual arbiter of presidential glory. Somewhat enigmatic and certainly esoteric, the Electoral College stands as a tribute to the Founding Fathers' well-founded distrust of the new republic's voting population. It also exists as a potentially genius solution to the variations in population density across the country and the unyielding desire for fairness in the democratic process.
Some argue that the electoral vote misrepresents the true(r) popular vote. Others claim that the College instead empowers underrepresented regions. Either way, until a Constitutional Amendment changes the process, electors will meet on the first Monday after the second Wednesday in December to pick the president. Aside from a few confidence-rattling elections – such as when a Reconstruction compromise or a Congressional broker or a Supreme Court controversy determined the winner – the electoral outcome has been affirmed by both citizens and historians.
In order to explain the workings of the Electoral College to all levels of residents and students, PBS Learning Media has put together a terrific "Electoral Decoder." As a part of its Election Central page, this comprehensive and visually impressive resource demystifies the process and helps anyone become more familiar with the United States' democratic system.
For classroom teachers, a good initial stop is the video introduction to the tool and the methodology. Clear map animations lead educators and learners through the workings of the Electoral College. There is also a teacher portal that includes lesson plans and instructional suggestions.
The 2016 Presidential Predictor is an interactive map that employs a gamification approach, in which each student becomes a pundit and picks the winner of each state to see which candidate reaches the magic number of 270 electoral votes.
Users can also view the complete roster of electoral results from past contests, displayed in clear geographic statistics. The cartogram view is another valuable lens through which historians can employ design to make the data come to life. In this view, the cartogram resizes traditional map shapes to reflect a relative input, such as population or number of electoral votes. In other words, the states with more people become larger, distorting the recognizable scheme while highlighting the crucial swing locations.
In all, PBS' "Electoral Decoder" is an informative blend of straightforward geography, time-honored civics, and forward-thinking visualizations to make American elections more accessible.
Educating younger learners about the 2016 presidential election poses a real challenge. The esoterica of the primary and caucus systems can be difficult to explain. The intricacies of the Electoral College require a background in both United States geography and the Founding Fathers' intents. This year's candidate quirks present a special hurdle, since many of the well-publicized comments are NSFS (Not Safe For School).
Avoiding these challenges, however, would be a disservice. Pretending that the nation picks a president simply by totaling all the votes would be unethical. Teachers might as well never introduce advanced vocabulary or higher-level mathematics.
Fortunately, PBS Kids has assembled a terrific array of resources in its "You Choose 2016" platform. The kid-friendly range of videos, printouts, and interactives address all of the major election aspects at a level perfect for elementary students.
For example, the "Meet The Candidates" page offers a bingo-style look at age-appropriate trivia about Democratic nominee Hillary Clinton and Republican nominee Donald Trump. The "Videos" portal presents a wide selection of movies and clips, ranging from a live-action explanation of the voting process to an animated tour of the White House.
The "Campaign Poster" interface invites children to decorate and customize their own election placards. The "Trading Cards" area includes colorful renderings of presidents and first ladies to inspire students through a gamification approach.
All told, PBS Kids does a masterful job of avoiding the hard-to-answer questions about the 2016 controversies and instead highlighting the history and the fun of the U.S. presidency.
In the modern era, presidential debates have become must-see theater. In many cases, these general election showdowns have produced critical moments to determine the November outcomes. Even at their most pedantic, these debates are rare opportunities to hear the nation's leaders speak directly to citizens and to each other. Voters can judge how the candidates handle themselves on the world's largest stage.
The first debate between Democratic nominee Hillary Clinton and Republican nominee Donald Trump at Hofstra University (down the road from us here on Long Island) on Monday, September 26, 2016, is predicted to shatter television viewing records. Not incorporating this event into a day's lesson, therefore, would constitute educational malpractice.
Teachers need to foster in their students an appreciation for civics. They need to guide young people toward understanding rhetoric and messaging. They need to use policy discussions as springboards to social awareness and future voting choices. One way to do this is by incorporating the practices of game interactions. This "gamification" approach to learning puts students in the driver's seat.
Fortunately, PBS has put together two terrific resources to bring the debates to life. The first is "Watch The Debates" from PBS Newshour. It allows users to view and interact with every candidate confrontation since 1960. Students can watch full encounters or highlights, and they can respond with their own verdicts.
The second resource is "Join The Debates," from PBS Learning Media. This site provides educators with a poster and toolkit to stage student dialogues in their own classrooms. Based on the Harkness Method and Spider Web discussion, these detailed guides allow children to reenact the debate format. Kids become owners of their own opinions, and they gain a better appreciation of the rigors of presidential parleys and the complexities of global issues.
As our nation’s children head to back to the classroom, many schools find themselves trying to rein in kids’ summer impulses. Strict conduct policies are emphasizing rules and enforcing straight lines on students who are used to gamboling in backyards and lolling for hours.
Many Scandinavian countries, most brain science, and all veteran teachers would encourage the exact opposite. They would argue that instead of limiting play, educators should expand the amount of free time dedicated to socialization and creativity. Imagination itself is not learned, but it can be unlearned due to the drone of worksheets and mandates.
Source: ASIDE 2016
While many schools nationwide are reducing free play opportunities, our neighboring Patchogue-Medford district here on Long Island has actually doubled recess time from 20 to 40 minutes. In fact, a few Texas and Oklahoma schools now schedule recess four times a day. These changes are not capricious; they are part of studies such as the LiiNK Project, which has found that physical activity increases students' emotional well-being and reduces instances of bullying and stress. The American Academy of Pediatrics supports these findings with its seminal white paper about "The Crucial Role Of Recess In School."
Across the board, students, teachers, parents, administrators, kinesiologists, therapists, and test graders are all witnessing the positive outcomes of enhanced play time. The scientist Jaak Panksepp has devoted a career of research to answering two pivotal questions: Where in the brain does play come from? And is it a learned activity, or is it a basic function?
Source: ASIDE 2016
NPR has highlighted Panksepp’s studies, showcasing that play is deep and instinctive, shared across mammals, and integral to survival. Important social skills stem from play, in testing interactions, probing limits, and navigating hierarchies. In other words, play is primitive, the natural outcome of time and trust.
Children need this unstructured time to make mistakes and develop friendships on their own terms. The arena of the soccer field or the sand box is ideal in nurturing successful adults. Recess is not a privilege. It should not be an afterthought. It should instead be written into the students’ Bill Of Rights.
Otherwise, what are our playgrounds? Are they monuments to eras past? Are they the still testaments to the naivety of earlier generations? Are they just another hallmark of the sped-up modern day, the never-enough-time-for day, when the things we wish for are just that — wishes?
For other ideas about the importance of play, we recommend:
Design is the marriage of message and motif. It is the intersection of identity and icon. In crafting a logo or a slogan or a character, the end symbol is the summation of both the shape and the story.
That’s why the images of the Olympic Games have reached such exalted status. The five rings are a beacon of continental unity. The posters and medals and mascots have linked arms through the years to provide an intriguing portrait of episodic design trends and nationalistic pride.
The Olympic torch is an often-overlooked aspect of sports history. Many viewers might remember the televised cauldron lightings, but few can recall the specifics of each particular torch style. This is a shame, because the Rio 2016 cresset is a testament to careful design and deeply embedded meaning.
For a look back at past Olympic torches, this wiki outlines a complete list of manufacturers and designers. For a visual gallery, the Olympic site includes icons going back to the 1936 Berlin Games.
The torch relay, in particular, inaugurates the Games as the flame travels from its Greek origins to then crisscross Brazil in an escalating parade of famous athletes and historic sites. Mapping this journey through graphics and animations offers valuable chances to learn about geography and culture.
For better or worse, current events also feature prominently in the torch's travelogue (much like the 2014 Sochi controversies). At various stops, the Rio carriers have so far been attacked with a fire extinguisher, beset by an unruly jaguar, and accused of carrying a "cursed" flame.
In essence, the torch relay is a fitting cavalcade to the heroic spirit of the competition. It builds anticipation for the contests to come, and it shines a spotlight on the country's locales and heritage. It also welcomes the world into a terrain that may be unfamiliar. This widening of the learning lens is crucial in pushing students to look outside themselves. Sydney's 2000 triumph and Beijing's 2008 spectacle both prove the worth of these quadrennial jamborees.
For more ideas about exploring the Olympics or using the Games in education, check out:
It's rare that a single flower becomes a viral, stakeout sensation. We admit that we've been fixated. While YouTube eyes are currently obsessed with a grotesque and freakish bloom, educators may be missing an opportunity.
Yesterday the New York Botanical Garden (NYBG) announced that after a decade of cultivation, the Amorphophallus titanum finally began to bloom. Commonly known as the "corpse flower," this plant from Sumatra in Indonesia exudes the smell of rotting meat as it opens. The putrid odor and the otherworldly shape are keys to its appeal, as its startling height. The flower has notched the Guinness World Record for the tallest bloom in cultivation at over 10 feet (and even larger in its natural habitat).
The New York Botanical Garden first hosted a successful bloom of the corpse flower in 1937. A second emerged in in 1939, but generations have past to witness the third revelation of this dreamy, rancid blossom. Visitors have been lining up, and online watchers have been glued to the YouTube livestream, mostly because the scare appearance lasts for only 24 - 36 hours.
Why is this floral oddity relevant for teachers and students? On a basic level, this quirky natural artifact offers countless avenues for science learners to explore biology, botany, morphology, behavior, pollination, inflorescence, germination, dormancy, regionality, and cultivation. For example, the bloom is not actually one large flower. Instead it comprises a leaf-like ring of outbursts surrounding a central column.
On a higher level, the fascination with this shy and fetid flower speaks to every teacher's desire (and angst): how can we make make learning relevant? How can we pinpoint the moving target of our contemporary kids' attention spans? If they are attracted by a weird plant, what can we learn from this momentary buzz to inform our curricula?
Is it too much to ask that a daily lesson is unexpected? Is it pandering to give students something to anticipate, to look forward to? The allure of the NYBG "Corpse Flower Cam" lies in the waiting. It rests in the charisma of the macabre. Why does a flower smell so bad? What is the evolutionary attraction for carrion creatures that will come and spread the pollen?
In other words, all classes should unfold like a mystery. Children ought to be rapt in the one-in-a-million stories: the collapse of the Spanish armada, the elegance of Euler's identity, the chance of penicillin's discovery, or the lightning of a boy's forehead.
For locals, the occasion to visit a monstrous plant that reeks of spoiled flesh is priceless. Would that all of our classes were as exhilarating. For the rest of us, this is a neat moment that we should remember in September, to excite STEM learners and to wake up the drowsy kids who don't think our "Do Now" exercise lives up to their Snapchat feed.
On August 25, 2016, the National Park Service (NPS) turns 100. After a century of shepherding America's splendor, the Park Service and its personnel will rightfully be feted as dedicated, humble stewards of our country's most precious landscapes.
Personally, we have been lucky enough to visit many of the nation's 59 parks on all points of the compass. Each site has never failed to live up to its consecration as a place of American rarity, pride, and beauty. From the unspoiled trails to the popular overlooks, every curated destination within the wilderness is a testament to the work and vision of the Parks Service.
This august anniversary introduces many opportunities to weave the Parks into authentic classroom lessons. For example, the "Every Kid In A Park" initiative seeks to connect our nation's youth to its most treasured spaces. Additionally, a wide range of visualizations now provide easy ways to incorporate the centennial into state standards and skill-based curricula. At their least, these videos and graphics offer terrific kick-offs to a morning's discussion. At their best, these charts and illustrations support critical student proficiencies. They also bring to life the gorgeous panoply of natural wonder that would make any Disney confection blush.
To start, the "Find Your Park" website gathers videos and social media interactions of everyday first-person testimonials about the grandeur of America's vistas. As a companion, the NPS has opened its Geographic Information Systems (GIS) data to the public, for educators and graphic artists to tap in building models of terrains and visitations.
Some of the best renderings of the National Parks come from the Works Project Administration during the 1930s New Deal. These art deco posters from the Federal Arts Project capture the majesty of the otherworldly settings in colorful and appealing travel enticements. National Geographic has assembled a nice collection of these posters from the Library Of Congress.
In a video homage, the outdoor outfitter O.A.R.S. has put together a stunning tribute to the Parks, told through the stirring words of Theodore Roosevelt. As befitting its founder, the NPS takes seriously its safeguarding of America's geology. It invites students of energy, minerals, and paleontology to explore the singular contours and cliffs through open online access and badging of restoration and geoscience. These resources are terrific for earth science and environmentally minded teachers to investigate with their students.
In math and statistics, the minds at FiveThirtyEight (who usually spend their time worrying about political polls and baseball ERAs) have analyzed the popularity of each park. They crafted crisp graphs and charts for STEM educators to draw from in ranking the visitors to each venerated location. As they note, "the U.S. national parks have never been so popular," and the Great Smoky Mountains continues its reign as the most-visited National Park, due to its location and exquisiteness.
In probing the specifics beneath the Great Smoky Mountains' charm, researcher John Farrell raked the Instagram API to determine where in the Park photographs were most frequently snapped. His visualization layers social media atop traditional coordinate geography to present a new picture of the Park's usage. He includes similar map mash-ups for other coast-to-coast sites.
For its part, the NPS has put together its own retro advertisement, in the classic style of antique movie reels or 1950s television ads. This wry film is a perfect nod to the 100-year heritage of the organization. It also displays a warm embrace of every citizen who passes through the Parks' gates.
In order to help navigate the Parks, the Sierra Club has designed a System Map based on the urban subway template. This seemingly humorous rendering actually gives travelers a valuable guide in planning their vacations and in connecting the dots between regional marvels.
Finally, the purest representations of America's National Parks have always come from the minds of the country's painters. Beginning with the light portraits of Thomas Moran, many artists have sought to capture the glory of glaciers and geysers. Most recently, David Hockney scratched a series of brilliant sweeps on his iPad in his "Yosemite Suite." These personal, stylized views prove to any viewer that the nation's Parks are love letters to its wilderness. They are the last vestige against urbanity and a hallmark of global distinction.


)