Showing posts with label stem. Show all posts

Friday, July 29, 2016

What Is The Corpse Flower Sensation? And Why Is Viral Science A Learning Opportunity?

Source: National Geographic

It's rare that a single flower becomes a viral, stakeout sensation. We admit that we've been fixated. While YouTube eyes are currently obsessed with a grotesque and freakish bloom, educators may be missing an opportunity.

Yesterday the New York Botanical Garden (NYBG) announced that after a decade of cultivation, the Amorphophallus titanum finally began to bloom. Commonly known as the "corpse flower," this plant from Sumatra in Indonesia exudes the smell of rotting meat as it opens. The putrid odor and the otherworldly shape are keys to its appeal, as its startling height. The flower has notched the Guinness World Record for the tallest bloom in cultivation at over 10 feet (and even larger in its natural habitat).


The New York Botanical Garden first hosted a successful bloom of the corpse flower in 1937. A second emerged in in 1939, but generations have past to witness the third revelation of this dreamy, rancid blossom. Visitors have been lining up, and online watchers have been glued to the YouTube livestream, mostly because the scare appearance lasts for only 24 - 36 hours.

Why is this floral oddity relevant for teachers and students? On a basic level, this quirky natural artifact offers countless avenues for science learners to explore biology, botany, morphology, behavior, pollination, inflorescence, germination, dormancy, regionality, and cultivation. For example, the bloom is not actually one large flower. Instead it comprises a leaf-like ring of outbursts surrounding a central column.


On a higher level, the fascination with this shy and fetid flower speaks to every teacher's desire (and angst): how can we make make learning relevant? How can we pinpoint the moving target of our contemporary kids' attention spans? If they are attracted by a weird plant, what can we learn from this momentary buzz to inform our curricula?

Is it too much to ask that a daily lesson is unexpected? Is it pandering to give students something to anticipate, to look forward to? The allure of the NYBG "Corpse Flower Cam" lies in the waiting. It rests in the charisma of the macabre. Why does a flower smell so bad? What is the evolutionary attraction for carrion creatures that will come and spread the pollen?

Source: NYBG; Chicago Botanic Garden

Source: University Of Wisconsin-Madison
In other words, all classes should unfold like a mystery. Children ought to be rapt in the one-in-a-million stories: the collapse of the Spanish armada, the elegance of Euler's identity, the chance of penicillin's discovery, or the lightning of a boy's forehead.

For locals, the occasion to visit a monstrous plant that reeks of spoiled flesh is priceless. Would that all of our classes were as exhilarating. For the rest of us, this is a neat moment that we should remember in September, to excite STEM learners and to wake up the drowsy kids who don't think our "Do Now" exercise lives up to their Snapchat feed.

Thursday, July 28, 2016

Visualizing The National Parks - Celebrating 100 Years Of America's Wonder

Source: National Geographic

On August 25, 2016, the National Park Service (NPS) turns 100. After a century of shepherding America's splendor, the Park Service and its personnel will rightfully be feted as dedicated, humble stewards of our country's most precious landscapes.

Personally, we have been lucky enough to visit many of the nation's 59 parks on all points of the compass. Each site has never failed to live up to its consecration as a place of American rarity, pride, and beauty. From the unspoiled trails to the popular overlooks, every curated destination within the wilderness is a testament to the work and vision of the Parks Service.

Source: National Park Service

This august anniversary introduces many opportunities to weave the Parks into authentic classroom lessons. For example, the "Every Kid In A Park" initiative seeks to connect our nation's youth to its most treasured spaces. Additionally, a wide range of visualizations now provide easy ways to incorporate the centennial into state standards and skill-based curricula. At their least, these videos and graphics offer terrific kick-offs to a morning's discussion. At their best, these charts and illustrations support critical student proficiencies. They also bring to life the gorgeous panoply of natural wonder that would make any Disney confection blush.


To start, the "Find Your Park" website gathers videos and social media interactions of everyday first-person testimonials about the grandeur of America's vistas. As a companion, the NPS has opened its Geographic Information Systems (GIS) data to the public, for educators and graphic artists to tap in building models of terrains and visitations.

Some of the best renderings of the National Parks come from the Works Project Administration during the 1930s New Deal. These art deco posters from the Federal Arts Project capture the majesty of the otherworldly settings in colorful and appealing travel enticements. National Geographic has assembled a nice collection of these posters from the Library Of Congress.

Source: National Park Service

In a video homage, the outdoor outfitter O.A.R.S. has put together a stunning tribute to the Parks, told through the stirring words of Theodore Roosevelt. As befitting its founder, the NPS takes seriously its safeguarding of America's geology. It invites students of energy, minerals, and paleontology to explore the singular contours and cliffs through open online access and badging of restoration and geoscience. These resources are terrific for earth science and environmentally minded teachers to investigate with their students.

Source: FiveThirtyEight

In math and statistics, the minds at FiveThirtyEight (who usually spend their time worrying about political polls and baseball ERAs) have analyzed the popularity of each park. They crafted crisp graphs and charts for STEM educators to draw from in ranking the visitors to each venerated location. As they note, "the U.S. national parks have never been so popular," and the Great Smoky Mountains continues its reign as the most-visited National Park, due to its location and exquisiteness.

Source: FiveThirtyEight

In probing the specifics beneath the Great Smoky Mountains' charm, researcher John Farrell raked the Instagram API to determine where in the Park photographs were most frequently snapped. His visualization layers social media atop traditional coordinate geography to present a new picture of the Park's usage. He includes similar map mash-ups for other coast-to-coast sites.

Source: John Farrell

For its part, the NPS has put together its own retro advertisement, in the classic style of antique movie reels or 1950s television ads. This wry film is a perfect nod to the 100-year heritage of the organization. It also displays a warm embrace of every citizen who passes through the Parks' gates.


Digging deeper into the soil and flora, Luke Easterwood, Michael Gelon, Hadar Scharff, and Matt Soave have analyzed the Parks' Vegetation Inventory. They built a visualization series to "encourage insightful discoveries" through the Tableau interface. These charts and graphs drill down to specific physiognomic classes and leaf phenology details.

Source: mattsoave.com

In order to help navigate the Parks, the Sierra Club has designed a System Map based on the urban subway template. This seemingly humorous rendering actually gives travelers a valuable guide in planning their vacations and in connecting the dots between regional marvels.

Source: Fast Company

Source: David Hockney
Finally, the purest representations of America's National Parks have always come from the minds of the country's painters. Beginning with the light portraits of Thomas Moran, many artists have sought to capture the glory of glaciers and geysers. Most recently, David Hockney scratched a series of brilliant sweeps on his iPad in his "Yosemite Suite." These personal, stylized views prove to any viewer that the nation's Parks are love letters to its wilderness. They are the last vestige against urbanity and a hallmark of global distinction.

Thursday, April 28, 2016

The Worldwide Water Crisis - Animated Motion Graphics To Educate About The Earth

Source: Kasra Design

Students are always the first to want to care for Mother Earth. At our school’s Earth Day planting event on Friday, the kids asked why we didn’t do this more often — why we didn’t tend the gardens and grow vegetables and think about composting, recycling, and conservation on a more consistent basis.

The ensuing discussion led to questions about water. Each day seems to bring new headlines about the crisis in Flint or California, not to mention the global droughts that affect millions of people. Few people realize that only 2.5 percent of all the water on earth is fresh water. And two-thirds of that fresh water is locked in glaciers and ice caps, leaving only 1 percent to sustain the 7 billion inhabitants.

Source: Kasra Design

Think of the inordinate amount of water we use every day through drinking, cooking, bathing, cleaning, producing food, making products, and generating electricity. It takes 2400 liters of water just to make one hamburger.

A terrifically produced explainer video from Kasra Design, called "Precious Water - Animation Awareness," brings these startling facts to life through a kid-friendly cartoon. The motion graphic, seemingly made for the Iranian Butane Industrial Group, offers 10 ways each of us can make a difference in conservation. These kind of tips resonate with students, because they require little sacrifice but offer a big reward.

Precious Water - Awareness Animation from Kasra Design on Vimeo.

Aside from the obvious advice of not running water while brushing teeth or not letting toilet leaks last too long, there are some clever ideas. For example, if we reduce our shower times by just 60 seconds, we can save 570 liters of water a month.

Source: Matter

Another compelling motion graphic about the water crisis here in the United States is "Groundwater and the Drought: How the West Is Miscounting Water Supplies." Created by Jons Mellgren and Anna Mantzaris for "Killing The Colorado," a collaboration between ProPublica and Matter, this stop-motion video not only points out the facts behind our nation's water supply, but it also proposes genuine solutions at the governmental level. The design is appealing and cute for a wide range of young viewers, to get them excited early about working for lasting change.

Groundwater and the Drought: How the West Is Miscounting Water Supplies from Matter on Vimeo.

For other animated explainer videos to teach about STEM and the environment, check out:

Saturday, December 19, 2015

The 5 Best STEM Animations For 2016

Source: scenes.https://vimeo.com/126733859, WWF Brazil - Marine Program

2015 was a banner year for animations to engage students. These dynamic explainer videos proved definitively that print textbooks cannot keep up with educational, up-to-date motion graphics, especially in the sciences.

The sphere of subjects that fall into STEM's orbit keeps expanding. For better or for worse, K-12 courses are now binarly split into either "STEM" or "Humanities" categories. We would argue that this bifurcation is harmful, erasing the natural overlaps between the sciences and the liberal arts.

The effect, however, is that more and more designers and educators are creating brilliant interactive companions to traditional learning. Here are five favorite animations from the past year that will allow science and math teachers (as well as those in the Humanities) to kick off 2016 with a bang:

1. Math


This lively explainer video from Vox offers a primer in chart theory, as well as a caveat for undiscerning viewers of graphs. Entitled "Shut Up About The Y-Axis. It Shouldn't Always Start At Zero," the clip reminds math students that context is key in both reading and creating data graphics.

2. Environmental & Marine Science


WWF Brazil - Marine Program from scenes. on Vimeo.

This beautiful stop-motion animation offers a moving case study about the effects of urbanization on pollution. The "WWF Brazil - Marine Program" video, made in collaboration between scenes. and Wildgroeiers, highlights critical issues of conservation and biodiversity for any age group.

3. Astronomy


BBC Earth has designed a clear and compelling motion graphic to emphasize the size of the universe and the speed of earth's galactic travels. The 3D visualization employs time and scale to bring astrophysics to life.

4. Oceanography & Earth Science


Source: Cameron Beccario

Software engineer Cameron Beccario (@cambecc) has programmed a stunning representation of the earth's weather conditions. With regularly updated ocean currents, waves, temperatures, and anomalies, this interactive globe allows students to zoom in and rotate a la Google Earth. The educational opportunities range from oceanographers analyzing climate change to historians studying ancient trade routes.

5. Medicine


Source: The Washington Post

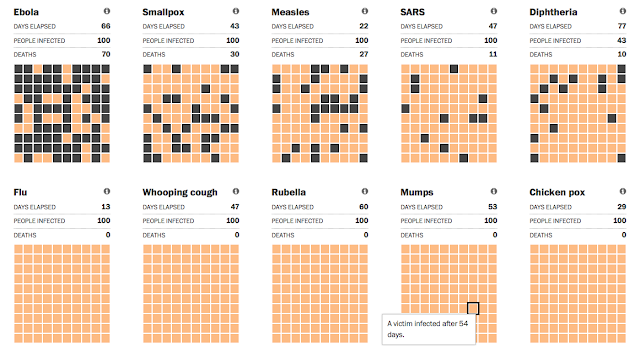
The recent Ebola panic prompted The Washington Post to create this precise simulation that compares the disease's spread to other historical pandemics. Although the original interactive graphic pre-dates 2015, the updates are important to medical students and social scientists who are trying to track contraction, infection, transmission, and vaccination.

Honorable Mention: Ecology & Forestry


This seemingly simple motion graphic by Nature Video brings into startling relief the rate of global deforestation. Researchers made 421,529 separate measurements around the world to produce an irrefutable data-driven image of the changing planet.

For more resources, take a look at last year's five best animations, or some of our other posts about animations in the classroom:


Related Posts Plugin for WordPress, Blogger...


Pin It