
Just as students move up in grade levels, enjoy more complex literature, and solve harder math problems, they also steadily encounter more advanced graphic representations. The skill of graphicacy incorporates clear methods and tools, just as linguistics and mathematics have their own terms and structures.
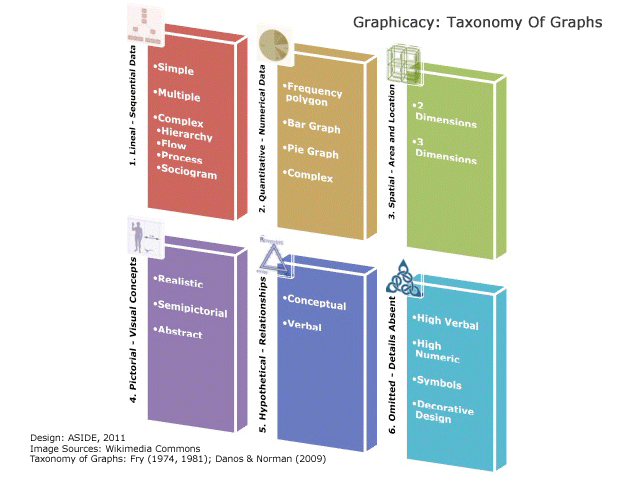
For example, in the “Taxonomy of Graphs” (Figure 8), Danos groups different types of displays based on Fry’s descriptions (“Graphical Literacy,” Journal of Reading, February 1981). In the taxonomy, the visual tools become increasingly complex, moving from literal to abstract:
- Lineal graphs show sequential data, such as story lines, timelines, flow charts, sports playoff brackets, or genealogy charts
- Quantitative graphs display numerical data, such as line graphs, bar or pie charts, or supply and demand curves
- Spatial graphs reveal area and location, such as floor plans, road maps, or contour renderings
- Pictorial graphs rely on visual concepts, such as realistic paintings, cartoons, or abstract drawings
- Hypothetical graphs address the interrelationship of ideas, such as theoretical models or sentence diagrams
- Omitted graphs intentionally leave out explanatory details, such as essay outlines, corporate logos, statistical tables, religious symbols, or decorative designs
)
ReplyDeleteI have been reading for the past two days about your blogs and topics, still on fetching! Wondering about your words on each line was massively effective. Techno-based information has been fetched in each of your topics. Sure it will enhance and fill the queries of the public needs. Feeling so glad about your article. Thanks…!
best software testing training in chennai
best software testing training institute in chennai with placement
software testing training
courses
software testing training and placement
software testing training online
software testing class
software testing classes in chennai
best software testing courses in chennai
automation testing courses in chennai
digital marketing training in chennai
digital marketing classes in chennai
digital marketing course in chennai
digital marketing institute in chennai
digital marketing training centers in chennai
digital marketing training institute in chennai
best digital marketing course in chennai
apply food license for meat shop
ReplyDeleteapply food license for bakery
food license fee for processing
ReplyDeletefood license fee for repacking
Thank you for the lovely article. Very much useful. You can use some family tree maker and draw your preferred family tree family tree maker for easy reference.
ReplyDelete
ReplyDeleteThanks for posting, it is really helpful. We are a leading Digital Marketing & Web Designing Company in Delhi. Visit us.
Digital Marketing company in Delhi
Web Designing company in Delhi
keep posting informative articles which is interesting and very useful information. Python training in Chennai
ReplyDeleteNice article
ReplyDeleteGuidelines
http://www.jeevisoft.com