Showing posts with label visual thinking. Show all posts

Friday, January 14, 2022

What Is Wordle? 5 Ways To Use The Latest Puzzle Craze In The Classroom

Source: Wordle

If you haven’t yet heard about – or played – Wordle, you will soon. The current avalanche of Twitter mentions run about 50 / 50 between “I'm addicted to Wordle!!” and “What the heck is Wordle??” Our friend Dr. Gina Sipley (@GSipley) tipped us off to the craze via a writer's poignant plea in McSweeney’s for a moment's escape from the Omicron nightmare.

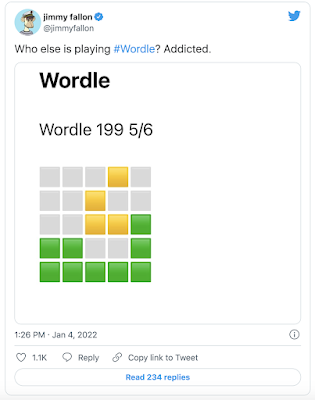
At its heart, Wordle is just a guessing game. Players have six chances to guess a randomly generated, five-letter word. After each entry, the tiles light up to signify whether the letter is not in the word (gray), in the word but in the wrong location (yellow), or in the correct location (green). The rules reappear at the start of each game. CNET, of course, has a terrific, lengthier explanation, complete with smart tips and tricks.

Source: Powerlanguage.co.uk

For teachers, this web-based game hits all of the technological sweet spots: 1) it's free; 2) with no logins or accounts; and 3) works on any device. And its addictive gaming properties turn out to be the exact same characteristics that make Wordle ideal for use in education:

Source: Wordle
Language And Linguistics

Wordle is the perfect opening activity to a Language Arts lesson, at almost any level. It also offers countless opportunities to explore the building blocks of the English language – such as vowel and consonant combinations (phonemes, diphthongs, etc.); common starting and ending pairings; and familiar vs. rare individual letters. The shear number of five-letter words in the English language (over 150,000) presents the challenge. Solving the riddle, however, is simple phonemic detective work.

Logic

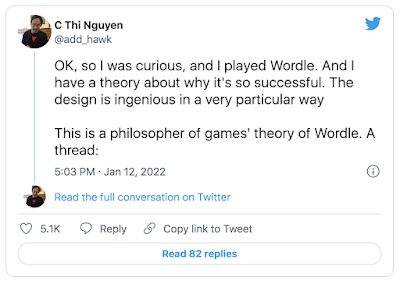
Any mathematics or logic course could make great hay out of Wordle’s elegant solving patterns. The reasoning relates clearly to geometric proofs and properties. An entire period could be spent leading the class through a group-solve. It echoes those LSAT puzzles when Priya is holding a red balloon and Xavier can only sit next to the dog in the yellow vest. Philosophy professor C. Thi Nguyen has an interesting thread about Wordle’s game theory and “agency expansion.”

Homeroom Or Advisory

Wordle is a lively activity to engage students in a quick challenge. The unique thrill is that only one puzzle appears each day. This creates an increased anticipation and savoring of the moment. You can welcome students to work in groups or to compete in speed vs. accuracy. Be a sport and play the game yourself, to show that you’re not afraid of some friendly fun.

Source: Wordle


Visual Thinking

The clean, elegant interface belies the effectiveness of its iconography. The simple visual codes contain the game’s entire meaning and feedback. The sharable results, rendered only in colored cubes, represent masterful lessons in visual literacy and graphicacy.

Social Learning

Everyone plays the same puzzle each day, which lends a contagious camaraderie to the effort. Results are easy to share on social media. This does lead to some humble brags and “woe-is-me,” but it's refreshing to find some fun and support during these oft-disconnected times. You might even run into a celebrity or two.

As an aside, we are old enough to remember when a “Wordle” referred to a visual cloud representing the frequency of word usage in a passage.

Finally, don’t tell, but there is an open-source version on GitHub where you can play the game as many times as you’d like.

Monday, December 7, 2020

'Tis The Season And Joy Was On The Menu - Student Designs To Promote Well-Being

Source: 6th Grade Students

It's December, and it's been a long, long year for us as well as our learners. We're teaching hybrid, and our students go in and out depending on concern and fear of the virus. They definitely needed a pick me up by week 13, and that's when we read Dr. Dolly Chugh's recent post on Dear Good People entitled, "No Justice, No Joy." 

Source: Dear Good People


We couldn't ask for a more perfect advisory activity to promote joy as well as student agency and creativity. The students received a quick overview of the seven tips for a "Quick Joy Sandwich," with instructions for designing their own "Joy Menu" using a Canva template.
 
Source: 6th Grader
 
Their charge was to think about the heading from the article that read "Joy is as essential as food" to create a menu complete with appetizer, main course, and dessert. They loved it. Each student brought his or her own take to the three course meal, and each handled the descriptions differently. They took the opportunity to create catchy headings of their own with descriptions for their plates that were anything but food. 
Source: 6th Grader

We wish we could share all of them, but the sampling is indicative of what can happen when kids have free range to express their joy, especially in the world they live in right now. For a full size look at these joyous delights, click here. No matter the season, joy is as essential to learning as it is to the social and emotional well-being of our learners.


What would your joy menu look like? As Dolly Chugh recommends, take a look at the tips she provides and make your own "Quick Joy Sandwich."


Source: 6th Graders


Tuesday, June 23, 2020

Commitment To Design, Visual Thinking, And Now The Virtual Classroom

Source: ASIDE 2020

The reminder popped up today for our ninth anniversary since starting this blog. We had good intentions of entering the fall of last year, ready to contribute more to our passion and commit to haring our ideas, but life changes. We've had changes in job responsibilities, personal additions and losses to family, and of course, COVID19.

So today, on our anniversary, we begin anew. We never wavered from our initial mission; instead, we pivoted toward a range of other opportunities. While a good portion of what our students did was in the brick and mortar phase, it was the virtual classroom that advanced the realm of possibilities for learning. The last three months reminded us more of the 18th century nursery rhyme, "Jack be nimble / Jack be quick," with students jumping over "lickety split" to synchronous online sessions of remote learning. Metaphorically, it was a stressful breeze.

Source: Imagine Museum

We were fortunate. Our students, already provided with devices and trained in using them, made the transition far easier than in many other cases. They worked on a number of different projects this year that pushed the boundaries of their design skills, their creative thinking, and their independence. As learners, they developed a knack for tackling new applications across a range of platforms to bring the world of transliteracy front and center, especially as it applies to digital humanities.

In the coming posts, we hope to share the latest work by our learners.

Thursday, July 18, 2019

Visualizing The Complexities Of Time and Place

Source: ASIDE 2019

Mapping challenges learners to think, develop literacy skills, and understand the complexity of global issues, design, and data. There is a direct correlation between the act of making a map and the knowledge acquired by doing it. Mapping their own visualizations increases a student’s understanding; they become more actively engaged in the learning process. This exercise in fine-tuning reinforces the notion of relational meaning and spatial adjacency. It is the fluid movement of change in time, position and detail instead of a static fixed point. It is about observing patterns or relationships alongside external connections. The chance to practice visual thinking through the mapping process builds proficiencies in reading multimodal, visual inputs.

Source: ASIDE 2019

Lessons And Resources


Mapping Activities For The Classroom

Current Events & Map Engagement

 Digital Tools And Hands On, Experiential Mapping
Source: Logos For Referenced Sites
Mapping As Social Narrative
  • Maptia: reimagines geography as a social narratives
  • Mapbox: choose layers and details to quickly share online
  • Mapstack: create custom maps, with easy access to social portals


Jerry's Map from Jerry Gretzinger on Vimeo.

Tuesday, July 24, 2018

Student Videos: Empowering Creativity and Video Journalism


Teacher videos are terrific learning tools, but student-created videos are even richer. Creating videos, motion graphics, and animations nudge students to blend a host of proficiencies. It involves visual design using colors and templates, just as it requires language skills of narration and storytelling.

The process of using a storyboard to stitch together a narrative enables students to combine logical reasoning, cause-and-effect, and content mastery. These compelling presentations provide opportunities for students to learn, share, and teach others. It reinforces the graphicacy skills they need to learn, design, and communicate a message as journalists.


Kids teaching kids is the purest model of learning where they become the educators of their peers. The examples below are just some the different types of videos, motion graphics, and animations made by our students.

MySimpleShow


Biteable


Magisto


Adobe Spark


Splice


iMovie & WeVideo


Stop Motion


PowToon


Renderforest


Vine


Class YouTube Channels

Patricia Russac
Mercer Hall

Class Tumblr  Pages

Mercer Hall


Friday, July 14, 2017

Building Data Fluency - Visually And Literally

ASIDE 2017
In this data-rich world, our students face growing amounts of statistical content. That's why we believe  teaching graphicacy is vital to the modern classroom. We develop ways to incorporate visual literacy and visual thinking in some capacity in most assignments and consistently look for ways that students can transfer content from a linear to visual format. This process enables them to connect more deeply with the material. The graphs in this post represent statistics on immigration that our students used to build graphs for a project-based learning unit on immigration.

ASIDE 2017
Each student studied a particular immigrant group for the project. For the graph assignment, they gathered the data for their group’s country of origin, as well as immigration data for two other countries. They recorded the information in a table format for five consecutive decades. While the organization of the data gave them a quick overview, the disparity in size of immigration over the course of 50 years was not immediately evident.

ASIDE 2017
Giving the students the opportunity to literally construct the graphs allowed them to experience visual data firsthand. Using the decades along the horizontal axis was easy; however, the vertical axis required a bit more intellectual work to determine the coordinates for plotting the data. Some had to revise their decisions several times by reexamining the numbers to adjust the coordinate values.

ASIDE 2017
The process of using statistics to construct meaning regarding immigration to the United States as visual data reinforced their understanding from both a historical and mathematical perspective. The students could visually see the highs and lows by group over time in addition to the places where immigration intersected or overlapped.

ASIDE 2017

Using statistics is an effective tool for learning. Since we know that our students will encounter numbers on a daily basis, the more we can do to build in data analysis, the better they will be able to make choices based on evidence and authenticity. Visual data is used in everything from household products to political campaigns. Without the proper skills, learners, like any other consumer, can be misled. Interpreting the pictorial representation of information is an essential skill of graphicacy; all students must master this proficiency.

Friday, June 30, 2017

Social Studies, Advertising, And Persuasion: Student Travel Magazines Sell Tourism

ASIDE 2017
Over ten years ago, we heard a presentation entitled “Ban the Bird Units” by librarian and educator David V. Loertscher. Essentially, it encouraged teachers and students to get away from the mundane use of facts as reporting mechanisms. This especially holds true today in the age of Google. At the time, Loertscher used the typical biographical research report as an example of a “bird unit” in which students responded to a series of questions that followed a timeline.

The state project is another example of the typical “bird unit” in which students have to find the state motto, bird, flower, etc. Ugh! Our question is who cares? Sure, it’s good to know your state particulars, but all that can easily be found on 50States.com.

ASIDE 2017
For us, it's the “so what” or remix of research to deliver content that demonstrates a higher-order thinking process with other skills that go beyond mere facts. The state magazine covers in this post required research, creative writing, and media literacy to do just that.

The students were challenged to develop clever ways to entice readers to visit their states, including titles that used alliteration for the magazine masthead and catchy sales lines just below the masthead with one of the state’s main marketing points.

They looked at the design and layout of real travel magazines. We discussed the different techniques that advertisers used to attract attention, and we critiqued covers based on design, color, and layout to see which ones were most effective in creating visual appeal. The students also observed the conventions for writing the story taglines as ways to hint at the content inside.

ASIDE 2017
The kids had a ball bringing their states to life, and they willingly helped each other out to create clever promotional ideas. The process seamlessly integrated social studies content with media literacy skills. Their finished designs became the focal points to attract visitors to their booths at the school's annual State Fair.

As for the birds, they left the nest!

Sunday, June 4, 2017

Sketchnotes: Pushing Linear To Visual

ASIDE 2017
It’s been a hectic spring, and as we approach the end of school in fewer than 8 days, we are busier than ever. Of late, we’ve had a tendency to overthink what to post, instead of just sharing the many good things that we do with our students to promote making thinking visual. To that end, we thought we’d share in this post some of the sketchnotes that our students completed this year.

ASIDE 2017

One of the things we try to do is steer clear of just filling in worksheets and graphic organizers; instead, we want our learners to design their own organizational structures of information. We did this with our digital citizenship pledge this year. The students visually designed their own pledges. This approach let them focus on the content and create a graphic display of what it means to be a good digital citizen.

ASIDE 2017
Since our students routinely use sketchnotes in a variety of subjects and on multiple grade levels, many of them include visual annotations, or doodles if you will, on their own as reference points. We see it in their notes and sometimes in the margins on an assessment.

A few other unique examples we wanted to share were completed in a lesson about the different types of primary sources. Ask any student about where they can find primary source information, and most will say books and the Internet.


ASIDE 2017
This sketchnote activity opens their eyes to the vast array of places to locate primary documentation and firsthand accounts of information. The examples in this post represent some of the unique ways our learners visually organize how they think about content.

Sketchnotes are used to give context to content, and this design process helps with comprehension and retention of material. It’s one more tool for helping students to make thinking visible.

ASIDE 2017

Wednesday, May 31, 2017

Making Learning Visible – 1st Grade Infographics

Source: ASIDE 2017
We’ve built our mission on the idea that making learning visible through design changes they way learners view content. The examples in this post by our first graders illustrate just how important design was in providing a context for their Arctic animal research. This was our youngest group to tackle creating infographics, and boy, did they do a great job.

This crop of little designers followed a set of guidelines set up by our colleague Stephanie Temple (@stemple3) to organize the information. The process allowed them to follow step-by-step instructions regarding font selection, number of pictures, and factual information. Of course, choice meant that the students could personalize their work once they completed the basic criteria. Several capable students also took it upon themselves to do more; this provided an added level of differentiation.

Source: ASIDE 2017
Using infographics offers students an opportunity to display their research in a visual representation that can be easily understood. Students from second through eighth grade know this process, and we’re happy to say that we’ve added first grade into the mix. In fact, by the time they hit middle school, it becomes routine. They learn to critique each other for contrast, layout, typography, and more.

Source: ASIDE 2017
We keep the elements and principles of design posted in our classrooms and also electronically on their student portal. As a result, we frequently hear students helping others on different projects using what they’ve learned. It’s just what we want; thinking visibly becomes second nature.

Friday, March 3, 2017

Make Your Mission Matter: From Vision To Values - NAIS 2017

Source: NAIS

The National Association Of Independent Schools (NAIS) 2017 Annual Conference just wrapped up in Baltimore, Maryland. The two days of sessions, speakers, and confabs all highlighted the evolving roles of schools and school leaders within the ever-competitive learning landscape.

We want to express our sincere thanks to the room full of educators who came to our Friday session, “Where Learning Meets Design: Taking Control Of The Visual Classroom.” The questions and ideas made for a terrific conversation about graphicacy and the importance of visual proficiency in both a student’s and a teacher’s toolkit.

Source: ASIDE 2017

All of the links, resources, and videos from our workshop are posted on our “Visual Classroom” website. The PowerPoint from our presentation is also now live on the page. If you happen to take a look at the slides and graphics, please feel free to get in touch with your feedback and additions.

We also appreciate the enormous encouragement from our school’s Headmaster and Director of Communications in supporting our trip. It was a real treat as well to see our former head from 15 years ago pop into the back of the session room.

Source: ASIDE 2017

The highlight of this year's conference was without a doubt the lively and thought-provoking talk by Sir Ken Robinson. With characteristic wit and insight, Robinson reminded us that children are learning organisms. They love the internalization of language and ideas, but they don’t always love “education.” This is because the nation's school systems operate on efficiency, not talent. They prioritize shared cultural knowledge, rather than the inner yearning for discovery.

Source: NAIS
Other speakers included Susan Cain and her ruminations about the power of introverts to change the world, as well as intriguing sessions that focused on data-driven assessments and alumni engagement. The most fun, however, came from the accidental hallway encounters with long-time friends and colleagues from across the country. These sorts of run-ins are what make this gathering so meaningful.

Obviously, we didn’t make it out of Baltimore without sampling some crab cakes. We recommend The Oceanaire for their super-fresh, super-local seafood. Also, BricknFire Pizza Co. in the Baltimore Marriott Inner Harbor makes the best caramelized onion and mushroom pizza we’ve ever had.

Thanks to all of the NAIS organizers for staging such a smooth conference. And if you weren’t able to attend this year’s symposium, follow the #NAISAC tag on Twitter for great on-sight reporting and resources.

Friday, December 2, 2016

Maps Vs. Mapping: Visualizing History & Geography

Source: ASIDE 2016

Interactive mapping techniques invite students to connect with content to visualize information beyond mere location. Mapping challenges learners to think, develop literacy skills, and understand the complexity of global issues. It enables learners to seek new ways to look at information through a lens of inquiry-based analysis.

Fresh perspectives on traditional maps can help students classify the images they encounter and can assist them in developing their own visualizations of places and events. This finely-tuned practice reinforces the notion of relational meaning. It taps the core skills of graphicacy through the synchronicity of visual literacy and visual thinking.

As a result, our students become better geographers and designers by interpreting existing maps, by drawing their own maps with a cartographer’s eye, or by creating visualizations with a keen sense of space. Students must decode the augmented reality (AR) by "reading" images and internalizing pictorial stimuli. These precise, learned techniques foster confidence both in deciphering and in creating pictorial representations, as well as developing critical thinking skills to better understand the world.


Lessons And Resources


Mapping Activities For The Classroom


Current Events & Map Engagement


Monday, July 18, 2016

10 Ways Pokémon Go Augments Real-World Education & Student Learning

Source: Pokemon Go iTunes

In just ten days, the cultural sensation of Pokémon Go has attracted over 20 million players. It is the most popular U.S. mobile game ever, surpassing Twitter in daily active users and crashing its Niantic host server.

For those who are over the age of 30, or who have been been in a self-imposed digital blackout, or who did not luck into an 11-year-old at a Sunday BBQ to explain the intricacies, here is a one-sentence description of Pokémon Go: the goal is to explore one's neighborhood, using virtual GPS map data, to catch as many animated creatures as possible, building up their strength to defeat other players in head-to-head duels. For a more complete (and accurate) rundown, here is a better explanation, as well as a helpful video.

Source: Pokemon Go

With little marketing or publicity, the enormous success of Pokémon Go speaks to an obvious and inherent appeal. The game combines popular culture, virtual reality, physical movement, problem-solving, and person-to-person competition. Teachers, for their part, are breathing a sigh of relief that this app debuted in July, so children (and adults) can spend the summer getting it out of their systems. But educators also appreciate the many learning opportunities that exist within the Pokémon Go app.


As with all sudden fads, a host of important caveats have emerged this past week, including safeguarding private information, respecting hallowed locations, and ensuring personal safety. Also, as with most fads, this one game will not revolutionize education. That being said, here are 10 ways that Pokémon Go can support the skills of contemporary learning:
  1. Visual Literacy - The essential premise of the game is to interpret a virtual world. Users must recognize symbols and signifiers, which are the building blocks of visual literacy. Students must decode the augmented reality (AR) by "reading" images and internalizing pictorial stimuli. This fundamental skill is known as graphicacy.

  2. Map Decoding - The only way to succeed in the game is by following a colorful map, which by definition necessitates a proficiency with direction, navigation, and geography. Much like the geocaching craze, Pokémon Go draws from the Google Maps API to turn everyday sites into Gyms and Stops.

  3. Problem Solving - This Poké-distraction employs the best of gamification. It requires critical thinking, advanced planning, strategic puzzling, and dealing with uncertainty to keep all of the animated balls in the air.

  4. STEM & Big Data - Educators have been wrestling with the world of Big Data for years. Here, the foundation resides in math and numbers; how much combat power does each creature have, how much candy and/or stardust is on hand, and how long until an incubation period ends?

  5. Collaborative Learning - The app offers a mild distraction for a single user, but the expanded components come alive when a player engages with other combatants. In face-offs and in personal conversations at community sites, the game subtly draws students into cooperative play.

  6. Financial Literacy - Perhaps one of the most under-heralded benefits of the game is the tutelage in budgeting, saving, and allocation of resources. Players accumulate Poké Coins and consider micro-transactions, as they earmark incense, lures, and other commodities. The game is already hitting the FinTech world by storm.

  7. Physical Education - It's no secret that Pokémon Go promotes activity to walk and engage. Users must progress a certain number of kilometers before they can hatch an incubated egg. The app relies on the phone's sensors to distinguish between physical and automobile movement.

  8. Social Media In The Classroom - This app furthers the benefits of social media in learning. It encourages the emerging discipline of the Digital Humanities, as it also promotes crowdsourcing, sharing, teaming, and student avatars.

  9. History & Civics - A blessing of the game is that most Poké Stops are local landmarks. The designers have placed an emphasis on points of historical interest. In order to move up in the challenge, users must acknowledge the civic value of nearby, consequential events.

  10. Language & Lexicons - The superimposition of an animated Pikachu atop a real-world venue inspires countless prompts for creative writing. Also, the Pokémon creature world embodies an encyclopedia of names, abilities, and vocabulary that together accomplishes what all good reading does: it builds a facility with language and meaning.
Full disclosure: we are Pokémon novices, and for years we have never understood what our seventh graders were talking about at the lunch table. But admittedly, we are excited by the potential. For other ideas about apps and augmented reality in learning, check out:

Monday, April 4, 2016

Why Design Matters For Educators And Learners

Source: ASIDE 2016
We just finished attending the New York College Learning Skills Association (NYCLSA) Symposium in Saratoga. We met impressive educators who shared their expertise and resources, and we presented “Design Gives Context To Content To Engage Learners.” The following is an excerpt of why we feel so passionate about this topic.

The harmony between form and function not only applies to design, but it also relates to the synergy between educator and learner. It supports both. Good design of information guides the attention of our students, creating a relationship between context and content. It allows for engagement without distraction.

Design Matters, because it can:

  • Steer the eye of the viewer
  • Remove the noise and congestion
  • Separate ideas into succinct areas
  • Create a consistency across materials
  • Align information for clarity
  • Establish a hierarchy of content
  • Make information easier to navigate

Design plays an integral part in the skills of graphicacy, visual literacy, and visual thinking. If companies spend billions of dollars on advertising to grab our attention, it would make sense for educators to think about information design as well. With the growing industry of online learning, how we incorporate visual information makes a difference not only in the way a student engages with the content, but also how he or she comprehends the information over the long run.

Source: ASIDE 2016
Attention, comprehension, and retention, or “ARC,” are inextricably linked when the visual information is included in the overall design of content. It’s why people and kids remember commercial, jingles, logos, and brands. The connection increases engagement with the material, making it memorable. The more we incorporate these aspects into our teacher toolkit, as well as in the options that students have to deliver content, the deeper the link to the material.

Source: ASIDE 2016


Design can influence the perception of information, the visual communication, and the engagement with text. It enables learners to make associations, and it provides opportunities for greater understanding.

Monday, January 11, 2016

We're Big Fans: World Sketchnote Day 2016

Source: Sketchnote Army
Sketchnoting plays an integral part in our curricula, and we incorporate them whenever we can to help learners connect to content. This personal form of note-taking allows students to use the visual thinking process to design information in real-time through words and images. So it is with great pleasure that we recognize the inaugural, kick-off event for World Sketchnote Day. Follow the day on Twitter using the hashtag #SNDay2016 to see some amazing examples.

We've been huge fans of the process and have witnessed its extraordinary appeal to our students. While we encourage them to use sketchnotes whenever they choose, we often hear cheers of delight when we make it an active part of a lesson.
Source: ASIDE 2016

Our students understand that the visual cues in the sketchnote process help them connect to the material and enhance their recall of the content. Visually engaging with the information broadens connections and opens up the design process to think about the relationships between text and image.

We've watched the evolution in how students use sketchnotes to visually organize their information and to create a structural framework for the content they are learning.

There are lots of resources available to educators, and one of the most comprehensive is Kathy Shrock's guide to using Sketchnoting In The Classroom.

For a quick reference to help our students, we developed the one-page cheat sheet in this post as a handy guide to keep in their binders. Click here to download the PDF.

For other posts about sketchnoting in the classroom, please see:
Related Posts Plugin for WordPress, Blogger...


Pin It