Thursday, May 31, 2012

Take Notice and Media Literacy

Source: ASIDE
The natural extension in our media literacy curriculum for the sixth grade is the Take Notice project. It builds on the concept of questioning media that we've written about in other posts. This project brings together the techniques used in the art of persuasion through dialog and images to make a case for a particular issue. We are also lucky enough to have an Apple store that makes its space available to our students after hours for this special presentation. The evening itself is run like a media event, complete with a microphone and simulcasting on four large monitors at the Genius Bar.

Source: Apple Store, Manhasset, New York
In keeping with our belief that choice makes a difference in the outcome, we allow the groups to choose their topics for this project. Of course, they are age appropriate, but they address some tough issues that concern students. Interestingly enough, the parents are the ones who are enlightened by the middle-school mind, and many have often remarked that they had no idea that kids think about such hard-hitting issues. The topics run the gamut, including eating disorders, corporate espionage, hate crimes, global warming, cyberbullying and more.
 
Source: Power to Learn

Once the groups select their topics, each must develop an essential question it wants to answer and a solid thesis statement to guide the research. The students use a graphic organizer from the Power to Learn website to plan their editorials and to help guide them through the writing process. The final script, or screenplay, is compiled using Google documents before production begins on the movie. The sequencing of images follows the script to create the strongest impact.


The required time frame for each movie documentary may not exceed two and a half minutes in length, including a full works cited listing at the end. This forces the students to focus on the thesis statement to convey their particular point of view.


Producing their own documentaries not only makes others take notice, but also is a subtle way for the students to use the techniques in marketing, persuading, and promoting an issue. The Take Notice project empowers kids on another level as well. Their voices get heard, and adults take notice, too!


This is another example of project-based learning in TIME (technology, information, and media education) that reinforces the integration multiple literacies.

Monday, May 28, 2012

When Worlds Collide for Peace

Source: Pencils for Peace
Sometimes you wonder why things happen the way they do. In the long run, it doesn't really matter, but when circumstances occur to bridge communities for a purpose, it's wonderful. This is how the Pencils for Peace Project became part of the Paintings for Peace exhibition organized by Operation Democracy in Locust Valley, New York. The exhibition will travel to the town Saint Mere Eglise in the Normandy region of France as part of the D-Day commemoration this June.


Source: Operation Democracy
Last year, our Student Council was inspired by a simple and beautiful memorial in Boston of anonymous dog tags representing all soldiers who had lost their lives in the Afghanistan and Iraq wars and decided to start the Pencils for Peace Project. The students created their own memorial by hanging a curtain of pencils to represent each of the soldiers who died fighting in Afghanistan. 

The student-designed logo for the Pencils for Peace Project captures the essence of the peace symbol with a ring of adjoining children holding hands, and as one first grader told us, "it looks like there are hearts between each one." The long-term goal is to promote peace-building ideas and activities to resolve conflicts to make the world a more peaceful place.

Source: Operation Democracy
During our recent Celebration of the Arts, the choir dedicated their songs to peace, and a student made a moving slide show to go along with the performance. This powerful presentation caught the attention of a parent who put us in touch with Kaye Weninger, one of the directors for Operation Democracy and the curator for the Painting for Peace exhibition.

The original Operation Democracy began in 1947 as a grassroots effort to supplement the Marshall Plan after World War II. In 2010, the organization released a movie called the "Mother of Normandy" which is the story of:
"a remarkable woman, whose devotion to a generation of heroes transcended all boundaries. Mde. Simone Renaud witnessed the liberation of France on 6.6.44, from home in Saint Mere Eglise."
The rekindled Operation Democracy hopes to carry out the idea behind the original mission of humanitarianism and to reinstitute the historic concept:

"...the belief that peace cannot be achieved by governments alone but must start in the hearts of people themselves. It was felt that no government process could be a substitute for human understanding and that some way had to be found for the average American to do something about peace."
The goal to help our students become a generation of peace builders goes far beyond each of our local communities. In a world of war, violence and bullying, it is within our power as educators to promote peace and understanding. Whether through Pencils for Peace or Operation Democracy, let's build more bridges between our schools and communities to make the world a more peaceful place. It is a fitting reminder on this Memorial Day.

Source: Pencils for Peace

Friday, May 25, 2012

Branding The Next Generation

Source: Hyperakt
Brand or be branded. That is the warning for today's students. With mounting digital dossiers, young people are knowingly or unknowingly building online profiles. Born Digital and other publications attest to these growing data footprints, often initiated by parents while their progeny are still in utero. If children do not seize control of their own personal identities in social networks, they will be at the mercy of Facebook timelines and Google trackbacks. Students must brand themselves -- speak, or be spoken for.

"Personal branding" used to be a self-help platitude for acknowledging one's inner magnetism. Now it refers to the way individuals or groups are perceived by the world at large. Each generation, for example, receives a mainstream label based on vaguely defined epochal traits. Today's teens, however, are not easily pigeon-holed. It's no wonder that the amorphous modern IDs of "Generation X" and "Millennials" can't compete with snappy historical monikers like the "Lost Generation" and "Baby Boomers."

Source: Online Graduate Programs and Fast Co.Design
The next cohort of young people will create their own trademarks. Presidential candidates know this power of personal branding in selling themselves to prospective voters. Whether intentional or not, today's students will forever be searchable in defining themselves to future employers and mates. Teachers have always taught students to polish resumes and to practice interview responses. Now, we need to do the same for social media profiles.

Basil C. Puglisi, Executive Director for Digital Brand Marketing Education, argues that social media sites are like dating sites, where a combination of networking and sharing can help shape the persona one puts forward. The Student Branding Blog aims to help young people mold this individual positioning with advice and tools. Nick Nanton, who aids Hollywood stars in defining their celebrity trademarks, notes that "persistence pays" in not being afraid to "reinvent yourself."

Source: Hyperakt
In the vein of reinvention, teachers have lately seen their time-honored brand destroyed by attacks and scapegoating from state politicians. Even without vilification, teachers' "apple" and "ABC" identities have not kept up with modern times. Recently, WNYC's Studio 360 asked design firm Hyperakt to "create a new visual vocabulary that reflects the multidimensional role of the teacher." The initiative noted that:
"Teachers are currently represented by uninspiring, childish visual imagery. Images like apples, chalkboards, and the ABCs neither revere the profession of teaching nor do justice to the intellectual and creative development teachers help guide in students of all ages."
Hyperakt came up with new imagery to evoke connectivity, discovery, and process. The new branding effort envisions teaching as "connecting the dots."

Source: Hyperakt
To teach students about branding, a good place to start is with a brief visual history, including the wool tartan patterns of the 1500s that identified a clan's geographic home and the livestock irons on the 1800s that distinguished cattle ownership. Then, students can try to identify the logos of popular modern companies. Also, students can draw their own logos to "brand" whatever they are studying. For example, they can imagine emblems for historical eras or literary characters. They can devise icons for periodic table elements or Greek gods. This hands-on activity fosters symbolic thinking. Teachers can even brand their own projects and assignments.


A nice primer for students is the video "Personal Branding - What Color Is Your Brand?" from William Arruda at Reach Personal Branding. This easily digestible clip features plenty of nuggets about marketing and color associations. It is perfect for a media literacy lesson or for students to watch before creating their own insignia.

Source: Noupe
Another favorite site is Logopedia, an open-source wiki that features the logo evolutions of thousands of well-known brands. Designs are searchable by name or by theme (such as, "logos with a star"). Noupe magazine also highlights "Creative Brainstorming: 50 Examples Of The Logo Design Process." This terrific visual anthology of doodles, redesigns, and mock-ups can guide students in artistically generating their own ideas. Finally, the kid-friendly lesson "Super Brand," from the New York Times Learning Network, encourages students to trace the evolution of the Super Bowl logo and apply the same principles to creating their own brands.

For tools and websites to create customized student logos, check out our resources page.

Other resources for students include:

Tuesday, May 22, 2012

Visualizing Memorial Day and Those Who Serve

Source: Infographics Archive
Perhaps no holiday in recent years seems so poignant as Memorial Day. We celebrate it in the United States on the last Monday in May to commemorate all those in the armed services who have lost their lives in defense of freedom and democracy.

In an age when many children are sheltered from the news, few have a significant understanding of the sacrifices made by those who fight in harm's way. For this reason, doing our part as teachers to inform them of why they have a three-day weekend might be the only way they learn the significance of this day.

Too few students know that over 4400 soldiers lost their lives in the Iraq War. Add in the 1954 American service members who lost their lives in Afghanistan released by the Department of Defense, and the total climbs to over 6300 fatalities today. If we include the coalition casualties for both wars, 2896 in Afghanistan and 4802 in Iraq, the death total climbs to 7698. This is why we need to help our students visually see why this holiday represents more than the simple marking of the beginning of summer.

Source: CNN Home and Away
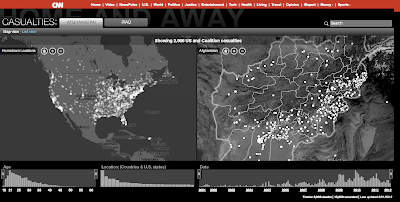
The CNN interactive map of war casualties parallels the hometown of the service member with the place the soldier lost his or her life overseas. The map allows students to put a name to a dot on a map, rather than looking at a mere list of statistics. Even the bar charts are interactive. By rolling the mouse over each one, students see the exact totals by age, location, and date. For example, the highest death toll of soldiers by age was 21.
Source: In the Light Urn

Most of our students were also too young when these wars started and don't realize the magnitude of the death toll on other families. So for this Memorial Day, let's take the time to share with them the history of the day to remember the fallen.

We hope the infographics that are scattered throughout this post will help teachers connect an otherwise three-day weekend and the opening of beaches with the much more needed realization that we should all remember the veterans who served our country, and continue to serve today.

Talk to your students about the importance of this holiday. Show them the numbers, draw connections, and commemorate Memorial Day. It could not be more important for their education.

Source: Infograhics Archive

Saturday, May 19, 2012

ImageThink: Graphic Facilitation & Big Ideas

Source: ImageThink
We recently attended the hands-on workshop given by ImageThink on graphic facilitation at the New York Peace Institute in Brooklyn's Mediation Center. Nora Herting and Heather Willems founded ImageThink and were the instructors for event. The makeup of the participants were from a variety of different professions who came together to learn how to “picture your big ideas” through the graphic facilitation process. This also made for a diverse sharing of ways we planned to use it in our own work experiences.

The roster of activities for the day provided a variety of approaches to the process, including graphic recording, drawing with the whole body, learning to listen, and more. Since so much of it was hands-on, the participants were able to get a real sense of what it takes to graphically produce notes in a non-linear way. We worked on large white paper, 48 inches in width and 8-10 feet long. After each lesson we discussed how we arrived at our image boards and received constructive feedback from the instructors.
Source: ImageThink

Using this method changes the view of the information. Essentially, graphic facilitation records ideas as they are being said. To do this effectively requires good listening skills to focus on the main idea and key points of the presentation to parse the necessary pieces of information to communicate ideas. In other words, the content is designed visually to make connections using words, images and numbers. It was also quite clear that it would be difficult to graphically facilitate a meeting and run it at the same time, and it came as no surprise that many of us wished we had had another day to learn even more. The following is a video demonstration from ImageThink showing how graphic facilitation works.


As teachers, we could also see that the process, although not complex, would require practicing before asking students to try it. Listening to audio such as a TED talk and then trying to graphically represent what is being said is a good place to start. Another exercise to help practice the process is to convert a standard PowerPoint presentation into a single page graphic summary. The added value to using this with students is the ability to present information clearly and concisely. It's also a creative and engaging way to help kids focus by captivating the content in a visual way. 

Headings, color, and size impact how the ideas are communicated, and the relationship between the words and images begin to rise to the surface. The ideation that sometimes starts in the minutia moves front and center, and the higher level points become actionable. To have kids use this method to graphically represent content will help train them to visual think about the key components of a topic. After all, don’t we constantly talk to them about figuring out the main idea and supporting details? Well, graphic facilitation is just another way of doing it.
Source: ImageThink Gallery
The ImageThink website is loaded with resources to help teachers get started. You can also follow them on Facebook and the Twitter hashtag is #ImageThink.

Wednesday, May 16, 2012

A Book Series and PBL in Media Literacy

Source: Capstone Publishing
The Fact Finder book series by Capstone Publishing helped us design one of our signature TIME (technology, information, and media education) project-based learning units called Question It. This set of eight books provides a perfect way to introduce media literacy to students in the elementary classroom. Each book covers a different media, including magazines, television, movies, music, news, video and computer gaming, online, and new media. Their catchy titles, such as Coming Distractions (movies), TV Takeover (television) and Music Madness (music), appeal to kids as well.

The similarity in design and format makes it easy for students to work in groups on a particular topic, and each book revolves around the five key questions toward becoming media literate:
Who made the message and why?
Who is the message for?
How might others view the message differently?
What is left out of the message?

How does the message get and keep my attention?
Source: Capstone Publishing
In addition, each book provides an overview of the people who work in the different media industries and the lingo peppered throughout, giving kids the language to understand terminology such as target audience and product placement, as well as other lingo particular to the field.

Source: Capstone Publishing
By using this series as a springboard for their project, the students learned about the reality of what goes on behind the scenes on their topic. They produced their own media pieces to teach their peers about the validity of online media, marketing techniques in magazines, or the gimmicks used in music promotion and movie hype. This included understanding the techniques used for product placement, fact verses opinion, appeal, and the art of persuasion.


The students used their research to create iMovies to inform others how to question what they see, hear and read in the media, and they made a formal presentation showcasing their work at our local Apple store. Plain and simple, these young media moguls took control and came away with a wealth of understanding about media conglomerates. Essentially, they became smart consumers by learning how to be media-savvy producers to teach others.


For more information on how we integrate media literacy into student learning, please see our earlier posts on the topic.

Sunday, May 13, 2012

Fun With Fonts or Teaching Typefaces As Tools

Source: Johnson Banks
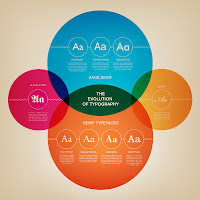
To many, typefaces may not seem foxy. Teaching about lettering probably assumes a low priority in most classrooms. But font choices can be some of the most critical and overlooked drivers of success in presentations. Our students typically suffer from two polar malaises: they either go font-crazy in choosing the wildest, neon-est, most calligraphic choices possible, or they completely ignore fonts in defaulting to bland, obscure, dark-on-dark presets. Either way, their creations end up difficult to read.

Source: 9GAG
In pamphlets, iMovies, essays, and posters, typefaces can matter a great deal. Fonts can become part of the messaging and design. They become tools for media literacy, in conveying a mood or a brand. The bursting popularity of typography blogs and Pinterest boards makes sense given the visual nature of today's communication. Logos and slogans spread easily these days amid an ad-soaked culture and a cheap dissemination of graphics.

We like to think that our students' yen for elaborate scripts is a testament to their appreciation for design and messaging. Really, they probably just like having a choice in exploring imaginative styles. We've posted before about the link between typography and language, and luckily, teaching about typefaces can be painless. There are plenty of easy tools and games to get kids juiced about picking the right font for the right moment.

Resources:


Source: A Type Primer
In teaching students about fonts, our favorite place to start is "A Type Primer," by John Kane. An extension of his book by the same name, Kane's clean, efficient site offers exercises and explanations to guide anyone in tracing the importance of lettering and line. Scholarly and comprehensive, Kane's resources are intended for anyone to explore at their own pace. Hands-on and practical, his systematic guide offers students a master course in typefaces.

Another useful resource is the "So You Need A Typeface" graphic from Abdul Jaleel Kavungal Kunnumpurath (or abjaleelkk). This flowchart begins with the intended use of a font (logo, book, infographic, invitation, etc.). It then charts various preferences to reach an optimal selection. Part handy resource and part tongue-in-cheek visualization, this illustration would be prime for a 1:1 class bulletin board or tech lab.

Source: abjaleelkk

Games and Tools:


Source: Kern Type
When lessons are over, games can offer fun extensions of learning. Kern Type is a game to teach kids about visual arrangement. "Kerning" refers to the spacing of adjacent letters within a text. Kern Type, also offered as a multi-touch app on the iPad, invites users to nudge and tweak letters to achieve an appealing word spacing.

A whimsical partner is the Google Kerning Trick. If you do a search for "kerning," the programming rascals at Mountain View will change the spaces between the letters of the word "kerning" in all of the results. Check out 17 of the Coolest Hidden Google Tricks for other fun, unrelated Google quirks.

Source: Type Connection
Type Connection, another clever web tool, is billed as a "Typographic Dating Game." Here, students choose a main character to partner with another letter. They then "send them on a date" to see if they can effectively combine fonts into appealing graphic matches. The game offers descriptions of letter shapes and origins. It also asks users whether they want to "rely on family," "seek the similar," "embrace the other," or "explore the past." The site for Type Connection, by Aura Seltzer, features a beautiful layout in its own right.

Source: Identifont
A more subtle resource is the Golden Rule Typography Calculator. Users can discover the perfect typography for their websites by entering the font size, content width, and line height. Identifont also helps designers discover typefaces by revealing the name of an unknown font. Upon encountering an interesting but unfamiliar font, users can search by name, similarity, picture, designer, or question to uncover the hidden identity.

Source: Design Shack
Another funny and surprisingly detailed site for learning font differentiation is "That's Arial Hot Shot: 5 Tricks for Spotting Helvetica in the Wild." Joshua Johnson, editor of Design Shack, offers clear visual tips to distinguish between the two oft-used, oft-mistaken, and deliberately similar typefaces.


Resources and Video:


A remarkable video, dubbed "Arkitypo: the final alphabet," from the Johnson Banks design studio, chronicles 100 years of typefaces. In twirling, evolving animation, the letters slowly evolve to reflect the machine age and the technological march.

Source: Glyphosaurus
A more practical visualization comes from the Boston design firm Upstatement, creator of the new typography app, Glyphosaurus. Combining "glyphs + thesaurus," this steadily expanding resource aims to create a "web database of letters." Like Spelling With Flickr for the design set, this curated collection allows users to select from various real-world designs of the same letter, all maintained by contributors and Upstatement. A beautiful teaser video created by the firm shows an elegant range of letter examples, in vivid colors and designs, artfully set to the tune of "Love Letters" by Nat King Cole. It is worth watching in a quiet moment.


Source: Visual.ly
For more tools and examples of typographic ingenuity, here are some of our favorites:


Thursday, May 10, 2012

The Goldilocks Effect - Visualizing Just The Right Amount

Source: Venture Beat
Whether they realize it or not, our students are inundated with numbers. It can be hard for them to get a handle on the competing streams of information from tech and social media. One way they can learn to negotiate this "Age of Big Data" is by becoming familiar with the different types of charts and displays. A taxonomy of graphs is a good place to start. They can also be exposed to data terminology, such as "model," "attribute," "variable," "quantitative," "qualitative," "aggregate," "granular," etc. In particular, Jeff Hendrickson of Armedia explains that most data can be filtered into three main categories: "temporal, relational, and quantitative." Guiding students to look at graphics that present these kinds of information can be good introductions to the world of visual statistics. As Hendrickson says, these simple tools can help give a method to the big data madness.
Source: Oliver Munday and GOOD

For young learners, the PlanetSmith blog gives a nice example of how simple math rules can assist third graders. The post, "Data and Decision Making," gives tips on how to combine multiplication tools with a fresh sense of urgency.

The easy access to data helps explain the benefits of visualizations as teaching tools. While experts point to William Playfair as the inventor of the modern chart in the late 1700s, not until the early 1900s does Otto Neurath earn distinction as the father of data visualization.

Source: Understanding Graphics
Data visualization is "the practice of turning raw, abstract data into usable, visual information." Nathan Yau of Flowing Data describes it as a "medium" for "telling stories." Well-crafted infographics, for example, can combine art with statistics to let students learn about current events or media literacy. Irving Wladawsky-Berger at the CIO Report underscores the point that as technology becomes more complex, design becomes more important than ever. Design, in essence, is a technique of problem-solving. Using shapes and colors to convey complex notions is at the core of interdisciplinary learning.

Two excellent resources for visualizations in the classroom are:


For further reading, check out our earlier post on "Education In The Age Of Big Data." Also, we recommend these articles about visualization:

Monday, May 7, 2012

Classroom Design - Feng Shui For Learning

In the past few years, we've been paying closer attention to our classrooms. We've been making time to rearrange our students' desks based on each day's goals. Some experiments have been more successful than others, but we've found that the class arrangement undoubtedly aids learning.

Room layout ideally should be an extension of the learning. Adaptable designs allow for differentiation. They avoid a repetitive setting and instead customize the space for lessons. Redecorating enlivens the children's experiences and provides flexible room for technology or discussions. Feng shui harmony translates to the classroom, as the arrangement matters.

When students enter a classroom and encounter a new configuration, they appreciate both the unpredictability and the predictability. They like the change, even if unexpected, because it validates the importance of their daily scene. Students begin to anticipate the learning by the day's arrangement, which itself is a decoding, thinking skill. Keeping a classroom fixed is not inherently bad, but it does suggest that information delivery might be fixed, too. Not updating a design is like not changing a bulletin board or not refreshing a homepage -- certainly not a crime, but not ideal either.
In our class, we are lucky (or unlucky) enough to have conventional, lift-top desks with separate wooden chairs. These end up giving us more flexibility than would rigid tables, which seem popular in some classrooms. We typically keep our teacher's desk in the back left corner. The SMARTboard is at the front. The designs below are a few of the layouts we've found to be effective:
Senatorial seating is our students' favorite design. They know the day will be mostly discussion-based, with plenty of visuals shared on the SMARTboard. The podium in the front is mostly pro forma, since we generally wander the classroom. Even in note-taking from PowerPoint or Prezi, the cozy, scalloped layout welcomes each child into the conversation and obviates the need for assigned or "preferential" seating. Students also know there probably won't be a pop quiz that day, given the close proximity of desks.
The independent template was once called "traditional." It used to be the teacher-driven model where students alienated themselves spatially in order to focus on the professor's lectern. This plan has been (perhaps unfairly) discredited by contemporary theory, and the repetitive lecture format is no longer trumpeted. The basic design, however, has taken on new life. Now the spacing allows children to work independently at 1:1 laptops or iPads. The room for movement invites self-directed work and hand-drawn projects. While students are exploring, the teacher can circulate freely, moving a small stool from desk to desk if desired. This evenly spread blueprint also allows for assessments, since authentic, non-plagiarized evaluations are still essential.
The seminar style provides the benefits of colloquy and sharing. Book discussions and writing workshops suit this format. The teacher sits at a chair in equal status as the students. No one is designated as the "leader." Socratic sessions, collaborative essays, and personal exchanges are all ideal here.
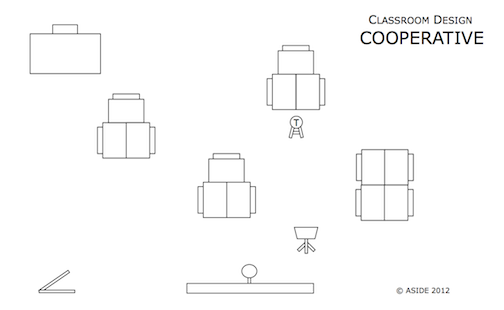
Cooperative groups obviously offer many benefits. The students instruct one another and solve problems in collaboration. The teacher can sit with whatever group needs extra attention. Differentiation, therefore, is essential in creating combinations, which will likely change depending on the day's activity.
Pairs are useful when students are sharing a laptop or are dissecting a text together. We happen to have an odd number of students, so the coupling is not always perfect. But the paired design is often an optimum arrangement for examining primary sources, handling manipulatives, or creating projects.
The partnered format is not the same as the paired design. Here, students face each other, which emphasizes face-to-face interaction. Again, the teacher can move from group to group, while the students work as lawyers and witnesses, Democrats and Republicans, or Montagues and Capulets.
In a debate, the teams need physical separation to plan their strategies. They also need clear sight lines to the opposing squad. The teacher at the podium has a minor role, as a student preferably would serve as the moderator at the desk. The SMARTboard is handy to record key points or to keep time.
Often our best classes occur when students don't take a single "note." In these cases, they might not even need desks. The theater design allows them to sit closely in chairs, without an artificial divide. The desks are pushed against the walls. The teacher becomes a spectator, as the group watches a film, takes turns at the SMARTboard, interacts with web 2.0 tools, or appreciates a peer's oral presentation.
Simulations turn the students into role-players, and the classroom can be made to mimic real-world contexts. We annually reenact a criminal mock trial with our seventh-graders, so this arrangement features a witness stand, a judge's bench, an attorney's podium, and council chairs. The desks are again against the walls. Other room role-plays could include a Congressional vote, a news broadcast, a Medieval castle, or a frontier campsite.

Update: Classroom Architect is a free, easy, interactive web tool to design sample layouts and move furniture in a virtual floor plan for your classroom.

Friday, May 4, 2012

Education In The Age Of Big Data

Source: Column Five and
Get Satisfaction
Major news outlets like The New York Times and The Wall Street Journal have recently blazoned what James Gleick, Hans Rosling, and Edward Tufte have known for years. We are living in the "Age of Big Data." Google search results, barcode scans, and checkout-counter zip code entries are all amassing catalogs of bits and bytes. Data is the driver of technological and business success. Those who best exploit their caches will emerge victorious.

The age of big data affects education in a number of dramatic ways, some obvious and others not as evident.

Source: Wikibon Blog
"Big Data" refers to what Forbes magazine calls the "dizzying amounts of customer records, sound recordings, images, text messages, Facebook comments and technical information that has to be stored, retrieved and understood in its proper context." This numerical index is growing swiftly in volume, velocity, and variety. In fact, "90% of the data in the world today has been created in the last two years alone," according to IBM. McKinsey & Company emphasizes this same rapid ascent, noting that "the increasing volume and detail of information captured by enterprises, the rise of multimedia, social media, and the Internet of Things will fuel exponential growth in data for the foreseeable future."

Source: FORA.tv and The Economist
In schools, students desperately need enhanced training in STEM proficiencies to parse and process statistics. The business community is hungry for analysts to make sense of figures and to program number-crunching computers.


Evaluative data is also actively used in state districts, to determine school ratings and teacher rankings. Crusading administrators treat standardized tests as sacrosanct. Student scores are twisted into digital knots to flay teachers for real or imagined failings. Educators who are ill equipped to fight back against the misapplied tallies will be on the losing end of data’s lash.


Source: Armedia, fifth.sentinel
Given the ubiquity of information, the real impact on education is the need for early exposure to data graphics and visual statistics. As charts, polls, and percentages fill children’s sight lines, they need the tools to internalize the meaning of their data-driven world.
 Graphicacy, therefore, becomes an essential literacy in teaching students to decode optical inputs and to encode their own numerical representations. Graphicacy as a discipline is emerging in progressive curricula to educate the big data generation most effectively.

For further reading, we like these articles:
Related Posts Plugin for WordPress, Blogger...


Pin It