Showing posts with label economics. Show all posts

Sunday, October 30, 2016

Halloween Treats To Keep Learners Focused

Source: Halloween Costumes
We work in an elementary school. So if you’re like us, Halloween always makes it difficult for kids to focus, especially with a school-wide parade at the end of the day. Our attitude toward keeping their attention is to use Halloween content to design lessons that tap the spirit of the day.

This year we found two new infographics to use with our learners. The first is The Evolution Of Halloween In North America. The timeline begins before 700 in three separate periods in history; from the 1900s to present, the timeline is arranged by decade.

Source: Halloween Costumes
The two-column layout of this infographic provides a visual connection between the history of the holiday and the literature and popular cultural aspects of the time. It’s perfect for scavenger hunts on the evolution of costumes, candy, and traditions.

Source: The Shelf
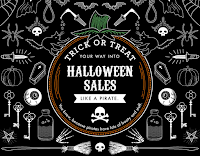
The other infographic that we thought educators would find useful is Trick Or Treat Your Way Into Halloween Sales Like A Pirate. The creator also designed "min-fographics," perfect for educators to put into any presentation software. The whimsical and colorful display to illustrate the economics behind the holiday is sure to enhance any math lesson.


The different sections of this infographic also provide ideal opportunities for data analysis of charts and graphs. They are just the right mix of visually appealing graphics with real numbers to engage students in making comparisons regarding sales, percentages, popularity, and more.

Source: The Shelf
We firmly believe a little deviation away from the routine to keep students focused pays off in the long run. Using infographics reinforces graphicacy skills, incorporates a little media literacy using Halloween hype, and celebrates learning with a little fun.

Source: The Shelf
Click here for other posts on incorporating Halloween ideas in the classroom.

Friday, May 27, 2016

1st Grade Entrepreneurs Master Media And Marketing Techniques

Source: ASIDE 2016
Our Nifty Notes first grade entrepreneur project is in its fifth year, and so is our push to educate the young learners about media literacy. This collaborative project brings together their study of economics, including wants and needs, supply and demand, and scarcity and abundance, with an understanding of the art of persuasion, marketing, and hype.

Source: ASIDE 2016
This year the goal to produce 1500 Nifty Notes was ambitious, but the first graders stepped up to the challenge, because they understood that they were raising money for charity.

It was extraordinary to watch them during their library classes grasp how marketing techniques help sell products. The media influence is so pervasive that they easily adapted commercial slogans and jingles to their product. They looked at contemporary media messages and discussed how phrases such as "limited editions," "one-of-a-kind," and "handmade" help persuade consumers to buy products.

Source: ASIDE 2016


Their ideas were so electric that they started generating their own teaser advertising techniques to sell Nifty Notes. One student came up with the idea just to put images around the school of the ladybug and bumblebee, the two new designs for 2016.

A few of days later, they added hot pink notes that began with, “Wanna know what the buzz is all about?” It goes to show how when educators empowered learners, they take ownership of their ideas. It also demonstrates just how much they see in the media.

Source: ASIDE 2016
Their promotion of the Nifty Notes sale did not stop there. Another first grader designed fliers advertising, “Nifty Notes Coming Soon.” We can only imagine what this Tuesday will bring to help promote the sale.

These first grade entrepreneurs got the point, big time!

Source: ASIDE 2016

Monday, February 29, 2016

Financial Literacy For This Generation - Visualizing The Future Of Wealth In America

Source: Chris Curtis

Financial literacy takes many forms. News headlines and candidate campaigns highlight the disparities of wealth between the "one percent" and the everyday Americans. In schools, traditional financial literacy classes teach older students about balancing their checkbooks and paying off their credit cards. These are noble messages, yet fundamental shifts are changing how young people spend and consume, from Bitcoin to online bill-pay.

Furthermore, financial literacy encompasses a much broader net of core fiscal issues, including stock investing, inflationary tendencies, surplus and deficit budgeting, bond and mutual fund accounts, and renting versus home ownership. Our youngest students need to be a part of this conversation, rather than waiting until high school or college, when it may be too late.

Source: Chris Curtis

Luckily, a host of digital resources exist to welcome all learners into the money discussion. A terrific explainer video from Chris Curtis, entitled "Wealth In America," tracks how life-long earnings vary for each generation. Moving from the proven past to the predicted future, this animated infographic addresses how collective wealth matters in determining future savings. The gauzy collage of photographs and stamps unites with compelling narration to inform today's students about their relative futures. This motion graphic of statistics and charts neatly blends STEM skills with the social sciences to prove that financial literacy is more than a single silo of curriculum.

Source: Chris Curtis

The video's creator, Chris Curtis, created this clip as part of his work with Deloitte University Press. As a director at Not To Scale in London, he has designed numerous short films that synthesize illustration with live action. He blogs at I'm Your Boss and shares visual and financial literacy ideas on Twitter via @imyourboss.

Source: Chris Curtis

As a whole, this video projects the dollar value of future household assets. It nods to the outsized influence of the Baby Boomers, and it highlights the fallout from the "Great Recession" of 2007. In particular, it teaches young people about earnings versus debt. The Millennials are sharers, non-idealogues, and social entrepreneurs. The salaries of these price-conscious, tech-nimble workers may rise steadily, yet their per capita wealth will lag prior generations. They will, however, force changes in the traditional marketplace that will realign how workers accumulate wealth.

Wealth in America from Chris Curtis on Vimeo.

For more ideas about teaching financial literacy, check out:

Monday, December 22, 2014

Financial Literacy, The Economy, And Holiday Shopping

Source: NBC News
We received a lot of questions from our students about "Black Friday" this fall. It seems the play up to the annual start of the holiday shopping frenzy grows earlier with each passing year. If your students are like ours, many did not understand the hype around this day, how it affects the economy, or for that matter, why it is so important to the bottom line of so many companies.

Source: NBC News
Many students are unfamiliar with the term  “being in the red,” so the concept of “Black Friday” makes little sense when it comes to the overall economy. The video from NBC entitled “How Badly Would the Economy Suffer If Holidays Were Cancelled?” illustrates just how much the holiday shopping season has an impact on the economy even though it is a small part of the total.


Sometimes we need to stop and explain the underlying lingo to help students realize the financial implications. It’s more than just shopping for gifts. It may be a small portion of the larger economy, but many people depend on the holiday shopping season to help make ends meet. The issue is not whether it is too much hype, but more importantly, how it affects others. Either way, we cannot assume our learners understand the economic impact based on the colors of red and black unless we educate them.

Friday, November 21, 2014

Thanksgiving: Supermarkets And Fair Food

Source: Food Chains Trailer

With the Thanksgiving holiday less than a week away, many schools around the country enter into conversations with their students about being grateful for what they have, showing gratitude to others, and starting food drives for the less fortunate. The heightened awareness, while noble, should be an ongoing conversation about empathy year round, and not slotted into a month where we overindulge with too much food.

Source: Food Chain$
So this year, we chose to talk to our students about who supplies their food. We did not mean which grocery store. We posed the question: What does it mean "from farm to table"? Kids have mixed messages about farm life from rosy images in picture books, nostalgic views in commercials, or pumpkin picking during October in contrived environments for entertainment. We wanted them to know more about the people who supply fresh food to markets and manufacturers.

We showed our students the movie trailer for the new film Food Chain$, produced by Eva Longoria, that premieres around the country starting today. The full length film hopes to raise awareness about the human cost in supplying food and the plight of the farmworkers who endure the backbreaking labor to get it to us. While we may not be able to see the entire movie with our students, the trailer provides enough information for teachers to open up a discussion about the role of large supermarket chains in determining the price of food.


The power supermarkets have over revenue in the agricultural system is enormous. Supermarkets earn $4 trillion globally. Their drain on the revenue from the food supply chain has left farmworkers in poverty, while retaining huge profits for the corporations. Many farmworkers endure harsh work conditions, and in extreme cases, they have been held in debt bondage, or modern day slavery.

Many schools, including ours, participate in fundraisers for charities and causes, and we applaud all that educators and students do to help, but hopefully by raising awareness about fair food programs, we can collectively help break the chain. It's a fair trade for one of life's necessities.

For more information, please see: Food Chain$: The Revolution In America's Fields.

Thursday, August 28, 2014

Resource Roundup: The Pencil Metaphor - The Point, Labor, And Fun

Source: ASIDE, 2014
We are down to the last few days before the Labor Day weekend signals the end of summer. All schools will be back in full swing next week, and summer Fridays will end for those lucky enough to have them in the work world.

For most educators, back-to-school decorations still include the proverbial apple, school bus, writing strips, and black and white composition notebooks. We definitely need a revamp in the bulletin board market to bring it into this century. We’ve yet to see tablets to add to the decor. That said, one of the most useful, iconic, and versatile images in education is the pencil.

Looking back, we wanted to round up some of our favorite resources that highlight the pencil as a metaphor for leadership, work, and fun.

The Pencil Metaphor graphic that has been reproduced in many places is a perfect place to start. It symbolically represents a continuum of where individuals might be on the learning curve of adapting new technology. The closer to the point, the more willing to take chances, lead, and share knowledge with others.

Source: Chief Technology Learning Center

I, Pencil: The Movie could not be better suited for the holiday weekend. It’s a symphony of human activity at work to produce one of the most basic tools used to record information, draft ideas, and doodle creations. It represents the interconnectedness of labor in the same way the pencil connects with learning.


Lastly, #Pencilchat had to be the one of the best viral chats on Twitter in 2011. It was friendly and a real mix of clever ideas, but at the same time a pointed discussion about technology integration with the coming onslaught of the tablet boom. We cannot help but revisit the hilarious video entitled Ode to #Pencilchat: Technology Integration in the Classroom.


Whether metaphor, symbol, or tool, the pencil is flexible, durable and timeless. We wish everyone a great school year.

Monday, August 25, 2014

The Nifty Notes Company: 1st Grade Entrepreneurship

Source: ASIDE, 2014
We introduced the concept of teaching first graders about entrepreneurship three years ago and never looked back. This spring, our young entrepreneurs completed their third successful year building the Nifty Note Company.

This interdisciplinary project-based learning unit reaches across subjects, including media, design, branding, and economics. When these first graders go into production, printing, designing, and packaging 1000 note cards from start to point of sale, it is mind blowing.

We learned this project at a presentation at the National Council for the Social Studies annual conference from the first grade teachers at the Collegiate School in Virginia. We modified and expanded their Critter Creations unit to brand our own company called Nifty Notes. It not only easily connected with language arts, math, and social studies, but it also could be expanded to include other components such as media literacy to broaden the learning concepts.

Source: ASIDE, 2014

It opened opportunities for the students to show off their creativity as well as make decisions about what designs would be best to maintain quality and consistency. Their inventive nifty characters (above) are something to behold.

Source: ASIDE, 2014
At the start of the project, each student gets an employee manual with the history, vocabulary, and job descriptions and qualifications for production. We use a host of resources to teach them about wants and needs, supply and demand, quality over quantity, etc.

Through stories such as Little Nino’s Pizzeria by Karen Barbour, the students learn about natural, capital, and human resources. These ideas are continually threaded throughout the entire process that believe it, or not, is completed within three-to-four weeks.

The multiple layers built into this project in addition to the actual production include doing a market survey, applying for a job in the company, filling out a job application, collecting data, creating the advertising for the school community, running the store, counting money, and issuing receipts. For samples of some of our handouts for this project, click here.

Source: ASIDE, 2014
Perhaps one of the most valuable takeaways the students learn is charity. Each year the first graders make a charitable donation with a portion of the profit from the sale of the note cards to an organization of their choice.

Source: One Hen Inc.
A go-to book that's perfect for helping young children know the importance of giving is One Hen: How One Small Loan Made A Big Difference by Kate Smith Milway.

The One Hen website also provides lots of addition material and ideas for teachers, and the non-profit organization, Kiva, lists opportunities for individuals to lend small amounts of money to help others around the world.

Source:Amazon
Our library has a strong collection of resources, including books at the primary level, for teaching economics with titles such as Do I Need It or Do I Want It from the Exploring Economics series, and Lemons and Lemonade: A Book About Supply and Demand from the Money Matters series. In addition, there are some excellent children’s picture books that we use to talk about money, opportunity costs, and marketing.

Teacher collaboration makes this project work. When first graders manufacture, market, and sell a product to real customers as a class business, the experience is priceless!


Source: ASIDE, 2014

Project Materials: colored cardstock, white envelopes, cellophane bags, mailing labels, inkpads, and Sharpie markers

For more resources, please see:

Wednesday, July 17, 2013

Resource Roundup: Finance And Economic Motion Graphics

Over the course of our research, we've gathered a number of resources to help explain financial and economic information to our students. These short motion graphics captured their attention and engaged them in the learning process far beyond our expectations. Since the videos are scattered throughout our posts on financial literacy, we decided to do a quick roundup here for the sake of convenience. Feel free to click on each of the headings below for lesson plans and project ideas related to each topic.

The United States of Financial and Economic Literacy

This motion infographic prepared by the Council for Economic Education shows the alarming statistics about monetary awareness. It brought to light the ever-growing need for more financial literacy in our schools. Even though many states have recently enacted requirements for students to take an economic or personal finance class to graduate high school, we should push for curricula in the middle school years when financial habits are beginning to form.


I, Pencil, The Movie

This animated film on economics and the interdependence in producing manufactured goods in a free market economy captivated our students. By using a low-tech tool that all kids use, the presentation provided an insightful look at the intricacies that go into producing a pencil, and it gave learners a real-life look at the many people who worked together to make it.


Wealth Inequality In America

This motion graphic highlighted the reality in earnings between the rich and the poor, which is quite different from the perception of most Americans. This visualization used charts, graphs, and images to give the students the hard reality of the distribution of wealth in the United States. Our students were quite surprised at how skewed the reality is from what most believe to be true.


U.S. Debt Visualized As Physical $100 Bills

Demon-Ocracy Info produced the following powerful, animated video to visualize the debt in the United States as physical $100 bills. Somehow the swallowing effect created by the bills engulfing Lady Liberty really hit home with our students. It set in motion a host of questions, particularly with regard to the "fiscal cliff" earlier this year.


100th Anniversary Of The Income Tax

Last year the 1040 Tax Form reached its centennial anniversary. This short video paved the way for kids to learn how the federal income tax works and who pays what percentage. They quickly learned why "tax day" on April 15 is not something working Americans look forward to every year.

Monday, March 11, 2013

Visualizing Wealth In America

Source: Digital Aptitude
Since we integrate financial literacy into our program wherever we can, we keep an eye out for visual resources to aid our students in comprehending complicated ideas. It also helps provide a greater understanding of things they hear about in the news. For months they’ve listened to the constant political fight in Washington over taxes, the fiscal cliff, and sequestration. So it is no surprise that students cannot fully grasp what the wealth distribution in America actual looks like, particularly the top 1% that is so often referred to in these debates.

We recently came across this excellent motion graphic called Wealth Inequality in America from Visually. It highlights the reality in earnings between the rich and the poor as opposed to what most people think. What most Americans perceive is not quite the reality. The visualization begins with percentages comparing the ideal distribution with what people believe. Then it hits the reality of the discrepancy. It reinforces the comparison with multiple charts and images to drive home the point. The actual distribution of wealth is significantly skewed far more in reality. This powerful visualization puts things in perspective for students.


Other motion graphics we’ve used to enrich our students’ awareness of financial issues include the following:

Thursday, December 20, 2012

The Mayans And The Fiscal Cliff In Infographics

Source: Good.is
So what do the Mayan calendar and the Fiscal Cliff have in common? Perhaps nothing more than counting down the end of days for the world or allowing taxes as we know them to increase. There's certainly no shortage of information in the media, and it seems hard to avoid talking about these "events" with our students.

Source: KarBel Multimedia
The presidential election was no sooner over in November than we started heading for the precipice. Judging from the current state of affairs in Washington, we just might fall.

Nevertheless, we are always looking for ways to keep our students engaged as we approach the holiday break, and there are plenty of dynamic infographics available. Here are some of our favorites that we've shared with our students, and as always, they can be used in a variety of disciplines.

It's the End of the World As They Know It from Good.is has some interesting statistics regarding countries that believe the apocalypse is coming and the dire predictions of how it will happen. Another is the visualization called Countdown To 2012 from KarBel Multimedia. This design shows the ticking away to the end as gears inside a clock. There are others, such as the End of the World or the believers and skeptics infographic, which parallels the views from both sides about the prophecy, celestial significance, cataclysm, and consciousness shift.

Source: Demon-Ocracy Info (detail)
As for Fiscal Cliff infographics, there are plenty that do a nice job of showing the two sides of the issue, both on the tax increases as well as on the political points of view. Any of these visualizations make for great discussions about economics, finance, and politics. It's hard not to see how they would fit into any social studies class.

One particularly interesting visual is The Fiscal Cliff - 2013 - Cheat Sheet by Demon-Ocracy Info that uses mounds of $100 dollar bills to illustrate the financial situation. It also produced the following powerful, animated video using the same concept of using $100 dollar bills to visualize debt in the United States.


A few others include the infographic from ABC News, incorporating the red and blue color scheme to highlight the political affiliation, and The Fiscal Cliff: What Does It Really Mean?, showing a different representation of the information.

Source: ABC News
In all of these designs, it's important to carefully dissect the details. One of the things we do with our students whenever we use visualizations is to compare the data and information for discrepancies.

A key component in our curriculum is media literacy, and it's important always to include the core concepts of media literacy whenever students are looking at infographics to check for possible biases or misinformation.

Source: Colorlines (detail)
In addition, we continually want to reinforce the skills of graphicacy to build our students' abilities to be visually literate and to be visual thinkers. So much of what they see depends on a solid foundation in these areas.


Wednesday, November 28, 2012

The Pencil - A Simple Lesson in Economics

Source: Competitive Enterprise Institute
The pencil is a simple "technology" compared to today’s tablet computers and smart phones. It looks easy to make such an uncomplicated tool. After all it's only wood, graphite and rubber, right? Not exactly.

The pencil, although much less complex to operate, takes a "village" to manufacture. The film I, Pencil: The Movie by the Competitive Enterprise Institute is based on a 1958 essay by Leonard E. Read and explains this multifaceted process and the network of people needed.


This animated film is a lesson in economics and collaboration. It's perfect for helping students understand the interdependence in producing manufactured goods in a free market economy and can be used at any grade level. Watching it will change the way they think and open their eyes to the worlds of industry, teamwork and dependency.

This simple presentation on the intricacies of producing a low-tech tool they all use is a perfect segue to introduce economics and promote greater financial literacy. Its straightforward presentation also demonstrates how it takes millions of people working together to produce a good so fundamental to learning, writing and communication.
Related Posts Plugin for WordPress, Blogger...


Pin It